February 2017 bulletin from Trading On The Mark
The final months of 2016 produced the sizable moves we had been expecting and writing about for bonds and precious metals. Now may be the right time to protect profits in the treasuries market and to look for opportunities to enter new positions in precious metals.
If you’re an active trader, our charting and analysis can be your guides to finding good entries and exits. New subscribers can get a full month of access to all the services we offer in our Daily Analysis and our Intraday Analysis for just the cost of the Daily Analysis alone. Give it a try, and see which service level works best for you.
Treasury bond futures and TLT
We had been watching a big-picture upward pattern in U.S. treasuries for several years, and those charts allowed us to predict some major inflections along the way. However, in March 2016 we showed our newsletter readers why we believed the pattern was reaching for completion. At that time, we emphasized that treasuries could still go higher, but warning signals of a sell-off were building. We also noted an unusual type of divergence between bond prices and yields that is usually followed by a reversal.
In June, the possibility of pattern completion made it reasonable to ask whether bond futures had reached a top, even though there was not yet any confirmation of a downward reversal. For most traders who include Elliott wave methods in their toolkits, this would have been a clear signal to exit from any remaining long positions even if there was a chance of price reaching higher.
Bonds went on to make a new high in July, but by September there were clear signs that the rally was on the verge of failure. We identified some resistance areas that would make attractive entry points.
By December, the expected decline was well under way, and we suggested some areas where traders might consider protecting their profits if they had shorted the move.
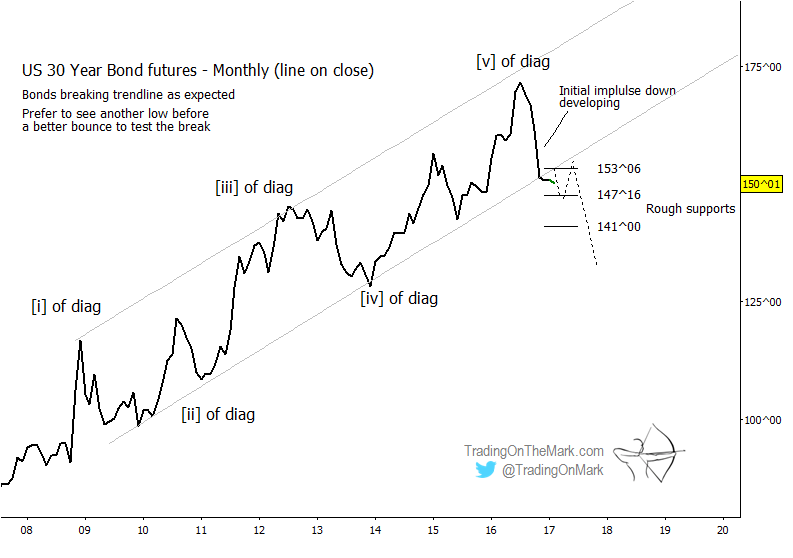
Looking forward, we will be watching price behavior near the edge of the channel boundary. Our line-on-close monthly chart for treasury bond futures shows how price recently made its first break below the channel that had contained the ending-diagonal pattern for several years. It is reasonable to expect price to test the lower channel boundary as resistance one or more times before the decline resumes in earnest, which suggests there could be some back-and-forth action among the Fibonacci-related levels we have drawn on the chart.
In the near term, a brief continuation of the decline in treasuries could produce a test near 147^16 or even possibly 141^00 before a larger bounce takes effect. However, we expect those supports to fail sometime in late 2017 or early 2018, leading to an even stronger decline.
The related ETF should follow the same basic script as bond futures, even though the pattern looks slightly different. TLT has not yet broken beneath the lower boundary of the diagonal pattern, but we believe it will do so eventually. In the meantime, watch for possible bounces from the boundary itself and from Fibonacci-related supports near 114.30-114.80 and 110.90.
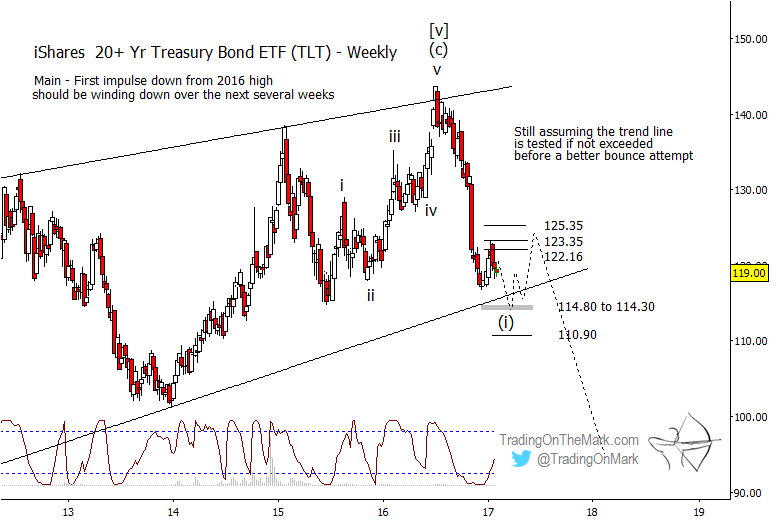
A near-term decline into support probably will complete downward wave (i) of what should eventually become a large five-wave sequence. A bounce in wave (ii) could then last through the middle part of 2017 or longer, and a declining wave (iii) should trace a move that is at least as powerful as the decline we saw last year.
Gold futures and GLD
It was late August when we suggested that readers should watch for a pullback in gold prices. In subsequent months, the SPDR Gold Trust retraced more than 75% of the gains it had made since 2015.
Prudent short traders would have at least some profits when GLD hit our original target area between 112.00 and 116.00. The retrace eventually stopped near the Fibonacci 78.6% support at 107.00, and price now appears to be rallying in the next stage of the Elliott wave pattern.
Looking forward, two scenarios stand out as possibilities for GLD. Both call for prices to rise for at least a few months. The main areas we will be watching as potential resistance later in 2017 are near 130.00 and near 140.00. Below, we describe each scenario. Both scenarios allow GLD to stay in a range for another year while the U.S. Dollar remains relatively strong.
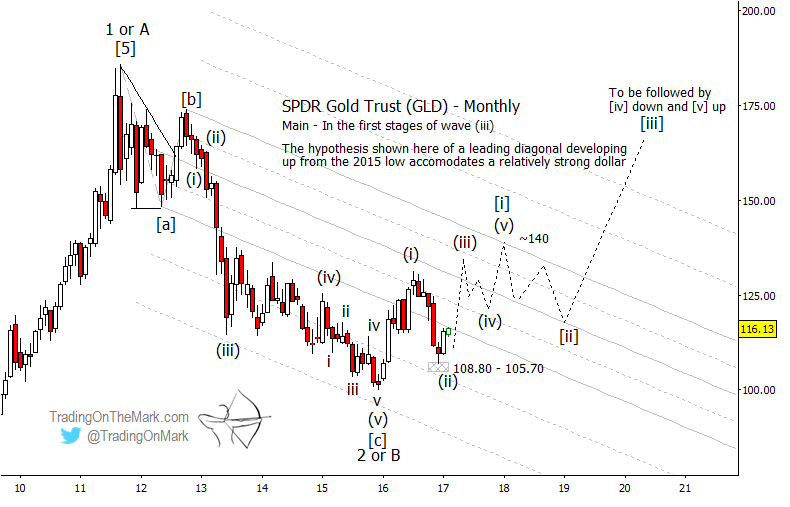
Main scenario: GLD rising in a leading diagonal pattern.
If GLD continues rising from the support area we have drawn near 105.70 – 108.80, the first scenario we will be following is for it to rally in a somewhat choppy fashion between now and approximately the start of 2018. The large downward-sloping channel drawn on the first monthly chart might still have influence during a rally, so traders should watch the channel harmonics as potential resistance and support.
The near-term trade in this scenario would be to see GLD climb fairly rapidly to test slightly above the July 2016 high, followed by a medium-sized pullback that stays above the December 2016 low. Those moves would represent sub-waves (iii) and (iv) of a five-wave diagonal sequence. Later in the year, sub-wave (v) might reach for the upper boundary of the channel, which would be in the vicinity of 140.00.
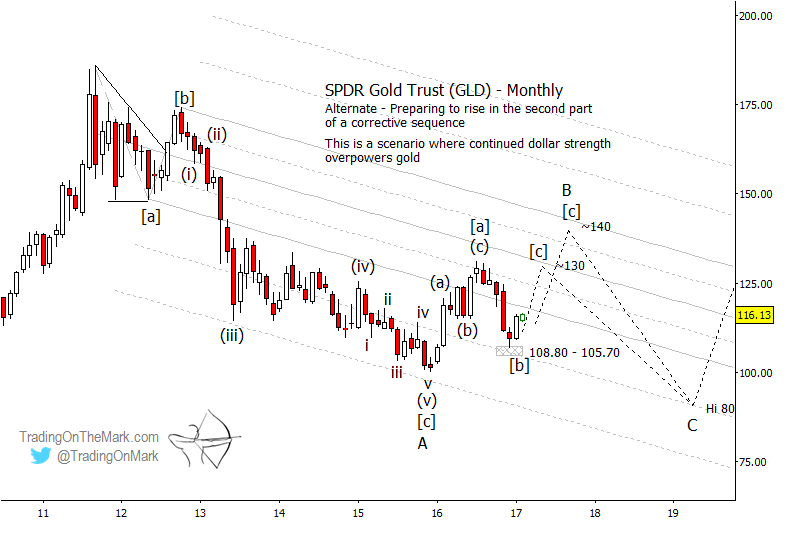
Secondary scenario: GLD is rallying in the final [c] wave of a correction.
In this scenario, GLD is working through the middle part of a large corrective pattern that began in 2011. A choppy upward move from the end of 2015 should consist of three sub-waves, but it is not yet clear how far the current (final) sub-wave will reach. Potential resistance defined by the channel is in the area of 130.00 and 140.00. Thus we have drawn two paths forward in our chart of the secondary scenario.
The way to differentiate between the first and second scenarios probably will be to see how much energy a pullback has after GLD has encountered one of the important resistance areas.
If the pullback is relatively shallow and price finds support at a Fibonacci retracement level or at channel geometry, that would favor the first scenario with price declining in a choppy, somewhat sideways wave [ii]. It would imply that GLD should try to form a higher low sometime around the beginning of 2018.
On the other hand, a rapid decline from resistance would suggest that price is falling in wave ‘C’ and is destined to make a lower low near the beginning of 2018.
The real take-home message is that gold still appears to be trading within the range that has contained it since 2013, and there is not yet confirmation that the pattern will allow a breakout. Until that confirmation arrives, the safest strategy is to trade based on technical considerations and be fairly quick to take profits.
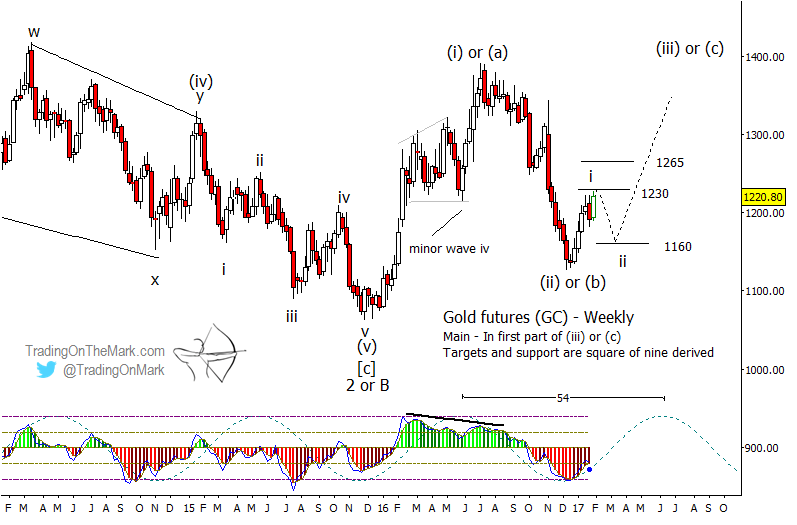
Near-term prospects for gold favor higher from support
The weekly futures chart highlights the value of the dominant 54-week cycle, which has corresponded well with price lows for several years. Now that the cycle is on the up-swing, we will be watching for gold futures to form a higher low this spring, perhaps in the next few weeks. Regardless of which big-picture scenario is working for gold, a higher low would probably represent the completion of downward wave ‘ii’ in a five-wave upward sequence.
With futures currently testing Gann square-of-nine resistance near 1230, potentially bullish traders might watch for a minor pullback soon. The next lower Gann level near 1160 could provide support for wave ‘iii’ to find its footing. The cycle suggests that a wave ‘iii’ high might occur during the summer.
There’s more!
Futures markets and related ETFs are becoming more volatile, and our subscribers are staying on top of them with both our daily service and our intraday service. Follow this link to see in detail what each service level includes and to learn about discounts for longer-term subscriptions.
All the best to you!
Tom and Kurt at Trading On The Mark