REMINDER: Starting on Presidents’ Day weekend, Feb. 13-15, we’ll begin posting all updates at tradingonthemark.substack.com. If you’re already a subscriber to our service here, we’ll arrange to have your access continue there without interruption.

The Day Ahead: PM Edition 2020-02-11
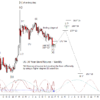
Bonds started higher on the day but ran into old support turned resist at 168^04 to 167^29 and fell away from in to have a down day.
The Day Ahead: AM Edition 2021-02-11
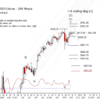
Bonds have held up as expected though slowing as it runs into the first extension targets up.
First Look: 2021-02-11
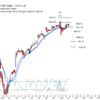
The rise in S&P 500 futures overnight has weakened the case for the high having been set yesterday.
The Week Ahead: 2021-01-24
Bonds continue to hold above the 167^17 and 168^07 supports but have yet to move up with any enthusiasm.
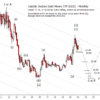
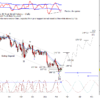
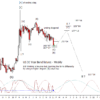
Gold Miners ETF (GDX) 2021-01-18
Since the US cash markets are closed today, I have been working on some charts I haven't posted on lately.
The Week Ahead: 2021-01-17
Bonds finally put in a possible precursor to a reversal candle last week where it dipped to test 167^17 but recovered 168^07 and a bit more by the end of the week.


Hit your targets
We believe an independent trader can succeed and profit in the markets, and we’re committed to helping our subscribers trade well on the time frame that best suits them. We founded Trading On The Mark in 2008 to help traders overcome some of the challenges of market analysis and trade execution. If trading futures and options based on technical analysis appeals to you, then you’re the kind of trader we want to work with.TOTM’s technical approach is grounded in Elliott wave and Gann techniques, while also making use of Fibonacci relationships in price and time, historical cycles analysis, proprietary technical indicators, and other more esoteric methods.
What people say about TOTM
If you love trading, I highly recommend Tradingonthemark! Tom, Kurt offer great charts and other technical stuff. It has improved my trading! — Moiz, intraday trader and long-time subscriber