It was late August when we suggested that See It Market readers should watch for a pullback in gold prices. In subsequent months, shares in the SPDR Gold Trust (NYSEARCA:GLD) retraced more than 75% of the gains they had made since 2015.
Prudent short traders would have at least some profits when GLD hit our original target area between 112.00 and 116.00. The retrace eventually stopped near the Fibonacci 78.6% support at 107.00, and price now appears to be rallying in the next stage of the Elliott wave pattern.
If you’re an active trader, this type of charting can be your guide to finding good entries and exits. New subscribers get a full month of access to all the services we offer, including our Daily Analysis and our Intraday Analysis for just the cost of the Daily Analysis alone.
Looking forward, two scenarios stand out as possibilities for GLD. Both call for prices to rise for at least a few months. The main areas we will be watching as potential resistance later in 2017 are near 130.00 and near 140.00. Below, we describe each scenario. Both scenarios allow GLD to stay in a range for another year while the U.S. Dollar remains relatively strong.
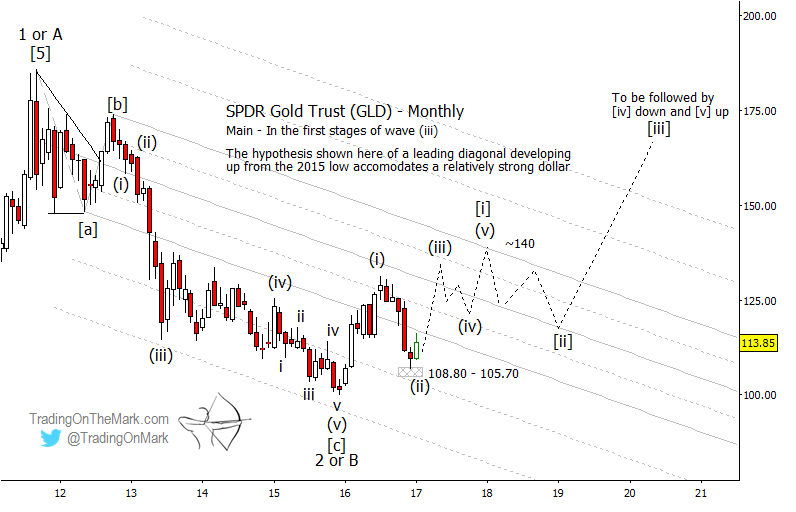
Main scenario: GLD rising in a leading diagonal pattern.
If GLD continues rising from the support area we have drawn near 105.70 – 108.80, the first scenario we will be following is for it to rally in a somewhat choppy fashion between now and approximately the start of 2018. The large downward-sloping channel drawn on the first monthly chart might still have influence during a rally, so traders should watch the channel harmonics as potential resistance and support.
The near-term trade in this scenario would be to see GLD climb fairly rapidly to test slightly above the July 2016 high, followed by a medium-sized pullback that stays above the December 2016 low. Those moves would represent sub-waves (iii) and (iv) of a five-wave diagonal sequence. Later in the year, sub-wave (v) might reach for the upper boundary of the channel, which would be in the vicinity of 140.00.
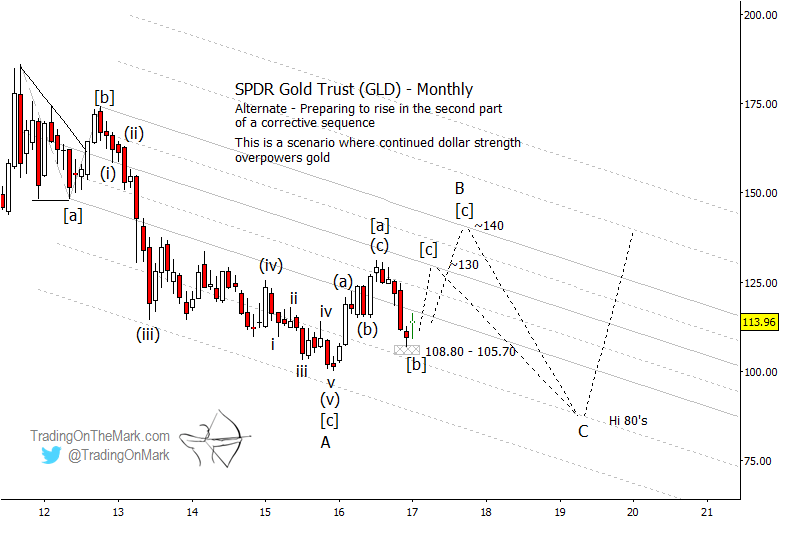
Secondary scenario: GLD is rallying in the final [c] wave of a correction.
In this scenario, GLD is working through the middle part of a large corrective pattern that began in 2011. A choppy upward move from the end of 2015 should consist of three sub-waves, but it is not yet clear how far the current (final) sub-wave will reach. Potential resistance defined by the channel is in the area of 130.00 and 140.00. Thus we have drawn two paths forward in our chart of the secondary scenario.
The way to differentiate between the first and second scenarios probably will be to see how much energy a pullback has after GLD has encountered one of the important resistance areas.
If the pullback is relatively shallow and price finds support at a Fibonacci retracement level or at channel geometry, that would favor the first scenario with price declining in a choppy, somewhat sideways wave [ii]. It would imply that GLD should try to form a higher low sometime around the beginning of 2018.
On the other hand, a rapid decline from resistance would suggest that price is falling in wave ‘C’ and is destined to make a lower low near the beginning of 2018.
The message for traders is that the near-term trade is probably upward, and it will be important to monitor price action near the resistance areas mentioned. We will offer a closer look at a near-term projection in our forthcoming newsletter, which you can request via this link.