Our mid-February post presented a modestly bullish forecast for gold prices in 2017. Meanwhile, our two leading scenarios for the U.S. Dollar Index show why it makes sense for gold bulls to temper expectations, because both scenarios favor a Dollar advance that would hinder any gold rally. Here we examine the two most likely paths for the Dollar this year, and we’ll expand on the analysis in the next edition of our newsletter. Follow this link to request your copy.
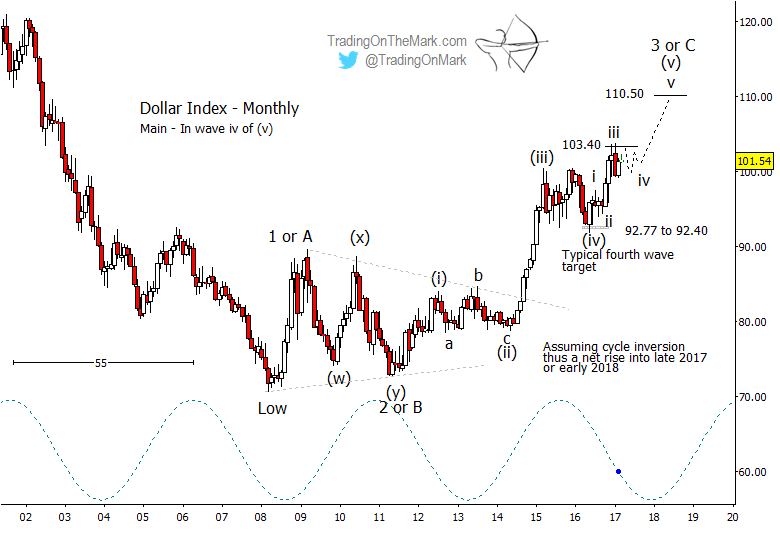
When the Dollar Index broke out of its consolidation pattern in 2014, it strengthened the case that the developing Elliott wave pattern would turn out to be a five-wave (i)-(ii)-(iii)-(iv)-(v) impulsive move upward. Subsequent price action has matched that expectation. Now we are counting the index’s progress up from its 2016 low as the fifth and probably final wave of the series, but the form of wave (v) is not yet certain. The Dollar could put in a fairly linear climb this year, or it could work through a choppy advance.
The next inflection of the dominant 55-month price cycle will happen near the end of 2017, and that probably will correspond to the completion of some aspect of the pattern. This would be true regardless of whether the cycle has inverted or not. (Since momentum and the likely Elliott wave pattern favor a continued push upward, we believe the cycle has inverted.)
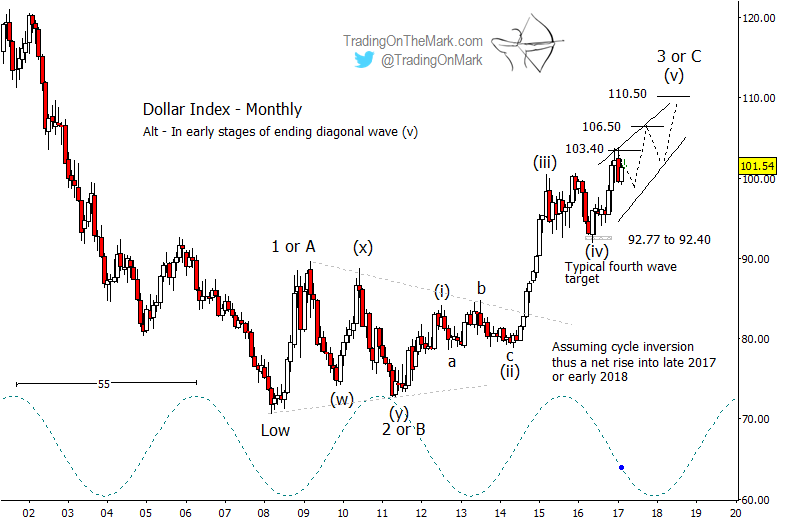
An eventual target area for the pattern near 110.50 is attractive based on multiple Fibonacci techniques, and there is probably enough time between now and the next cycle inflection for the Dollar Index to reach that level. The index’s behavior in relation to the current resistance at 103.40 may provide a clue about how direct the path will be.
If the index spends a few more months going sideways in a narrowing consolidation beneath the resistance at 103.40 and then breaks over, that would favor a fairly linear climb in sub-wave ‘v’ of (v) heading toward the target. That represents our main scenario and is shown on the first chart below.
On the other hand, a more substantial pullback from resistance could set up an ending-diagonal wave (v) that could take an indirect indirect path toward the target. In that case, traders should watch the estimated Fibonacci resistance areas and geometric support to navigate the swings, as suggested on the second chart.
Both of these scenarios for the Dollar Index suggest that gold bulls will face a headwind for the rest of 2017. That does not mean gold can’t advance, but the moves might not be dramatic. Traders who have the right mindset to trade modest moves in currencies and metals should do well.
Follow us on Twitter @TradingOnMark to get additional charts and videos!