Understanding this Dollar rally gives traders an edge in metals & currencies
March 2017 bulletin from Trading On The Mark
Some of our longtime readers might remember our saying it before. The sometimes overlooked U.S. Dollar Index gives traders essential context for understanding market conditions. Sometimes it can even help identify where specific turns might happen with other currencies and precious metals.
We believe the Dollar Index is prepared to climb for the majority of 2017, and that forecast informs our analysis and trades in other issues. However the near-term path of a Dollar rally is not yet certain. There are two Dollar-bullish scenarios that traders should consider. It comes down to how the Dollar Index is going to behave at nearby resistance.
Our first scenario would have the Dollar consolidate sideways for perhaps a two or three more months before breaking above resistance and moving in a fairly linear way toward its upward target zone. In that case, the “signal” coming from the index would be the breakout itself.
Our second scenario would have the Dollar decline in a moderate retrace as wave ‘ii’ of an ending diagonal pattern. In that case, the relevant signal would be a Dollar bounce from a higher low, perhaps near a Fibonacci support level.
The two scenarios are not extremely different. The main message is that traders working with a bullish view of the Dollar should allow for the possibility of some pullback soon.
In this edition of our bulletin, we go into more detail about the Dollar scenarios, and then we show some implications for trading the Yen and for ETF trades in UUP and FXY – funds tied to the Dollar Index and Yen/Dollar exchange respectively.
If you’re an active trader, this type of charting can be your guide to finding good entries and exits. New subscribers get a full month of access to all the services we offer, including our Daily Analysis and our Intraday Analysis for just the cost of the Daily Analysis alone.
Two upward paths for the Dollar
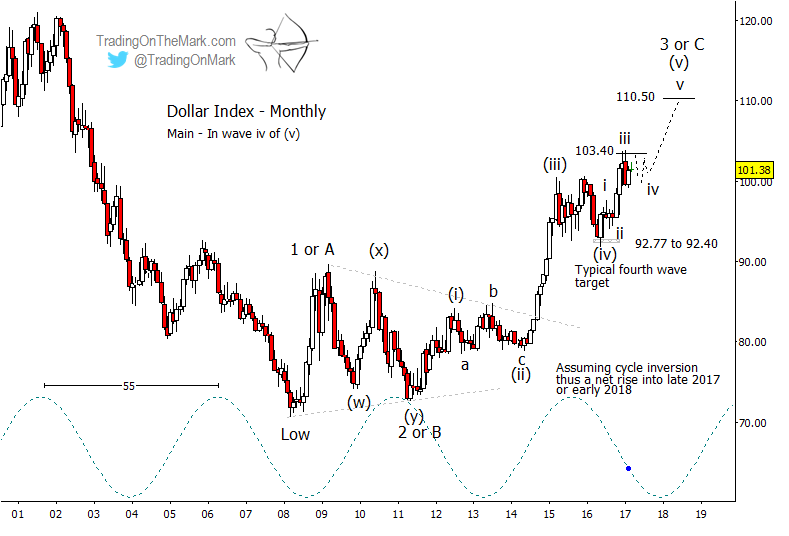
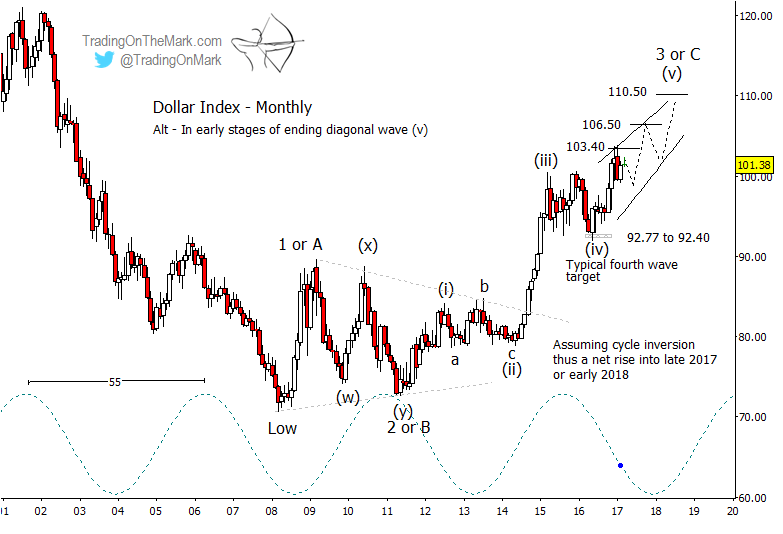
When the Dollar Index broke out of its consolidation pattern in 2014, it strengthened the case that the developing Elliott wave pattern would turn out to be a five-wave (i)-(ii)-(iii)-(iv)-(v) impulsive move upward. Subsequent price action has matched that expectation. Now we are counting the index’s progress up from its 2016 low as the fifth and probably final wave of the series, but the form of wave (v) is not yet certain. The Dollar could put in a fairly linear climb this year, or it could work through a choppy advance.
The next inflection of the dominant 55-month price cycle will happen near the end of 2017, and that probably will correspond to the completion of some aspect of the pattern. This would be true regardless of whether the cycle has inverted or not. (Since momentum and the likely Elliott wave pattern favor a continued push upward, we believe the cycle has inverted.)
An eventual target area for the pattern near 110.50 is attractive based on multiple Fibonacci techniques, and there is probably enough time between now and the next cycle inflection for the Dollar Index to reach that level. The index’s behavior in relation to the current resistance at 103.40 may provide a clue about how direct the path will be.
If the index spends a few more months going sideways in a narrowing consolidation beneath the resistance at 103.40 and then breaks over, that would favor a fairly linear climb in sub-wave ‘v’ of (v) heading toward the target. That represents our main scenario and is shown on the first chart below.

On the other hand, a more substantial pullback from resistance could set up an ending-diagonal wave (v) that could take an indirect path toward the target. In that case, traders should watch the estimated Fibonacci resistance areas and geometric support to navigate the swings, as suggested on the second chart.

Implications for precious metals
Both of these scenarios for the Dollar Index suggest that gold bulls will face a headwind for the rest of 2017. That does not mean gold can’t advance, but the moves might not be dramatic. Traders who have the right mindset to trade modest moves in currencies and metals should do well. In our previous bulletin, we outlined two modestly bullish paths for gold and GLD to take into 2018.
Implications for the Yen and FXY
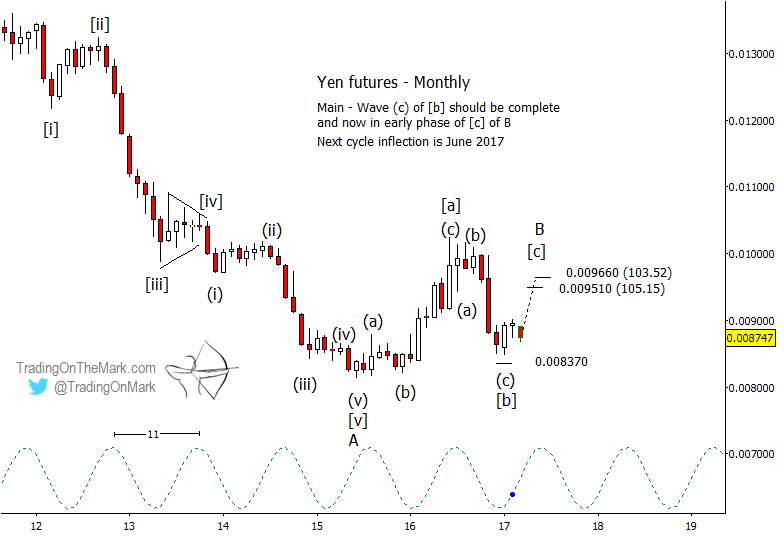
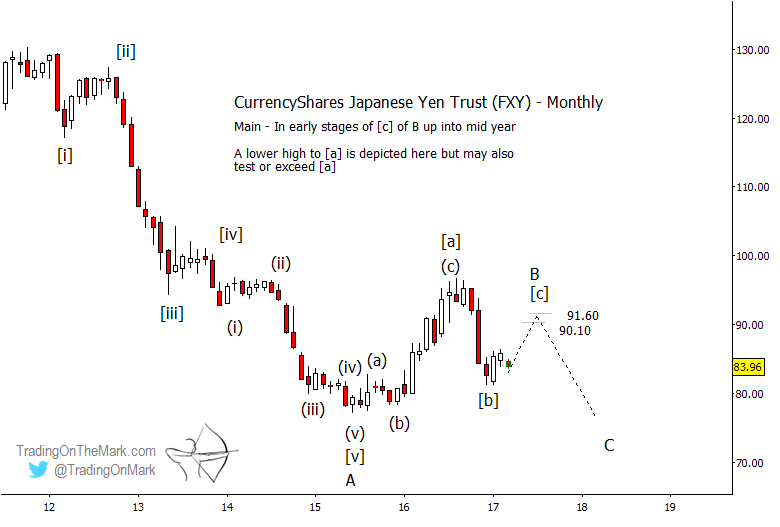
Last June, we presented a chart showing the decline we anticipated in the Japanese Yen by way of FXY. We were expecting price to test near an area of prior support as the middle wave of a sideways/upward correction. Now there are signs that the decline may be finished, and traders might begin looking for ways to take advantage of a modest bounce that could last several months.
In addition to the charts below, check out our recent YouTube video in which Tom talks through the Yen forecast.
Even though we are expecting a rally, the move still would be part of a larger corrective pattern. On the chart below, we have indicated some conservative targets for expected wave [c] of the [a]-[b]-[c] sequence that began in 2015. Fibonacci-related resistance lies near 0.009510 and 0.009660 (corresponding to 105.15 and 103.52 for those watching the inverse currency pair).

The main determinates of how high wave [c] travels probably will be the timing of the 11-month cycle and the extent to which the U.S. Dollar remains in its own corrective pattern. If the Dollar Index stays near its present value between now and mid-summer, that should lend a positive bias to Yen trades during the same time.
Equivalent upward targets for the CurrencyShares Japanese Yen Trust should be near 90.10 and 91.60.

The expected rally in the Yen and FXY probably will consist of five sub-waves. The first of those may already be complete, with price making a retracement now. Traders might watch for a higher low.
Implications for the Dollar ETF
The Power Shares DB U.S. Dollar Bullish ETF follows the Dollar index fairly closely, although channel geometry for the moves often differs slightly. With UUP, 26.68 is probably the main resistance to overcome in order for the expected wave (v) to take of in earnest. That level corresponds approximately to resistance at 103.40 on the Dollar Index.
If the Dollar and UUP require more time to consolidate before breaking upward, then we might see price stay beneath the zone near 26.38 to 26.55 for a few more months. That would be consistent with price tracing a narrowing range as a fourth wave triangle.

You could be getting more out of your trades
Our charts and analysis help subscribers stay alert to the turns with both our daily service and our intraday service. Follow this link to see in detail what each service level includes and to learn about discounts for longer-term subscriptions.
Sign up for the Daily Analysis service and get a month of complementary access to the intraday service and trading room!
All the best to you!
Tom and Kurt at Trading On The Mark


I’m trying to subscribe for a monthly intraday subscription using PayPal but your website doesn’t allow me please help
I think we can resolve this. Please see the email we sent to you recently.