As the U.S. Dollar spent the past several years working upward in an impulsive wave, so too has the British Pound cross been declining impulsively. We believe both markets can travel further after the 2017 pullback structures are complete. Right now there might be an opportunity to catch a resumption of the trend.
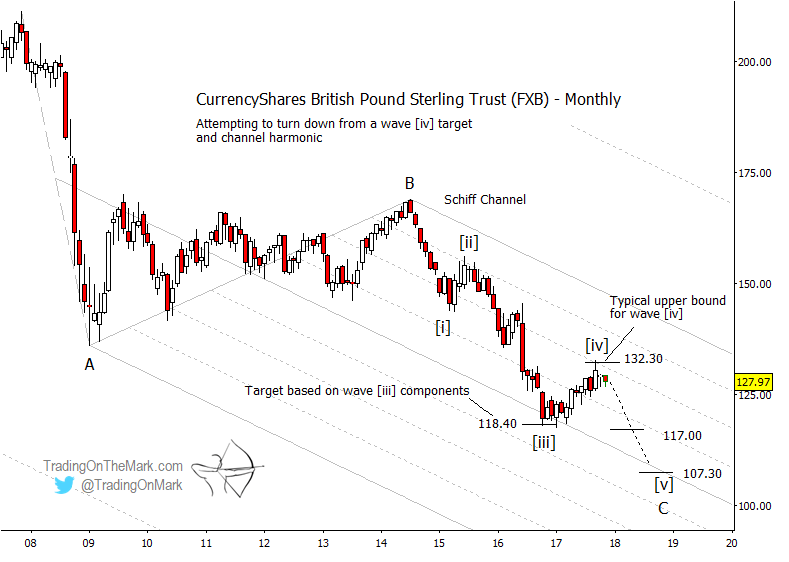
Here we chart the Pound/Dollar cross via the CurrencyShares British Pound Sterling Trust (NYSEArca: FXB). On a monthly chart we are looking for a five-wave structure down from the 2014 high. Our primary count considers the 2017 rally in FXB as a corrective wave [iv] in the structure, meaning it should be followed by a downward wave [v] to reach new lows.
In that scenario, the main question for a trader right now is whether there is enough evidence to treat wave [iv] as finished. Note that price tested the quarter division of the Schiff channel on the monthly chart — a good area to watch for resistance generally. It also tested a Fibonacci 38.2% retracement level at 132.30.
If price turns downward, then rough targets for the decline are near the 61.8% and 100% extensions of the length of wave [i], as measured from the tip of wave [iv]. As things stand right now, those levels are 117.00 and 107.30. We somewhat favor the lower target, but any new low would be sufficient to meet Elliott wave requirements.

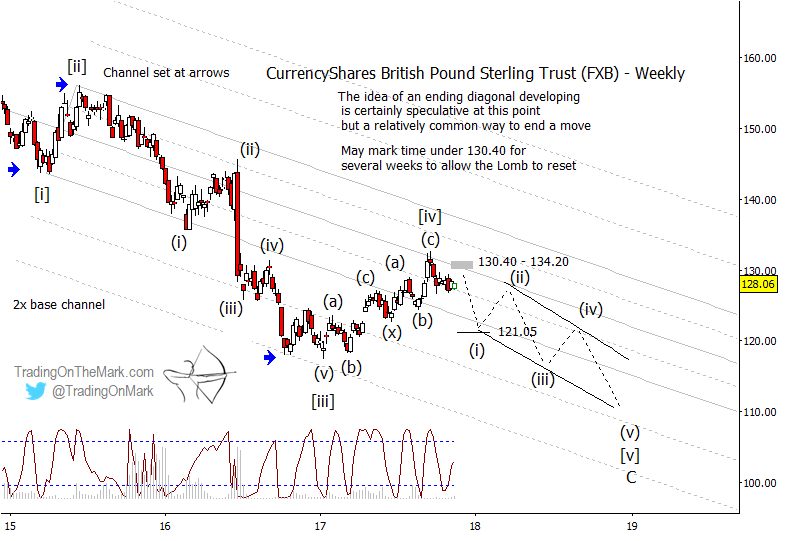
On a finer-grained weekly time frame, we note that the upward move that has occupied most of 2017 has a lot of overlap, making it corrective. It also has the correct number of sub-waves for it to be (possibly) complete. Note also that the recent price high tested the center line of a narrower channel that has guided the impulsive structure down in recent years.

Anyone seeking to trade the expected move downward might watch for a small upward pullback in coming weeks. The area between 130.40 and 134.20 is a likely target for that kind of pullback, although there is no guarantee it will be tested. The Lomb cyclic indicator at the base of the chart suggests that the ideal time for a minor pullback would be about two or three weeks from now.
Also, the trade might require some patience. The ending segment of a terminal impulsive pattern often takes the form of an overlapping diagonal, and we have indicated that idea on the weekly chart. A Gann square-of-nine support at 121.05 represents an initial target for the first move of the resuming trend.
