Last June, we posted a chart with some areas for equity bears to watch in the iShares MSCI Italy ETF (NYSEArca: EWI). Now the fund is testing the most prominent of those areas where geometry, Fibonacci measurements, and Elliott wave pattern all combine to identify the potential for a turn.
Our main scenario interprets the nine-year converging range as an Elliott wave triangle that should break lower. The nice thing about trading the conclusion of a triangle is that there are very clear rules that define the risk if the trade goes against you. A bearish trader seeking to catch a downward move out of the triangle knows that price cannot reach above the 2014 high of 36.88 without causing the whole trade idea to be reevaluated. Meanwhile, it might pay to watch price as it interacts with nearby resistance created by the descending trend line and/or the Fibonacci retracement levels at 32.80 and 34.80.
Note that price is already poking above the retracement level at 30.30. If EWI were to lose that level as support prior to testing the next areas of resistance, that would be an important signal that a downward turn might have begun.
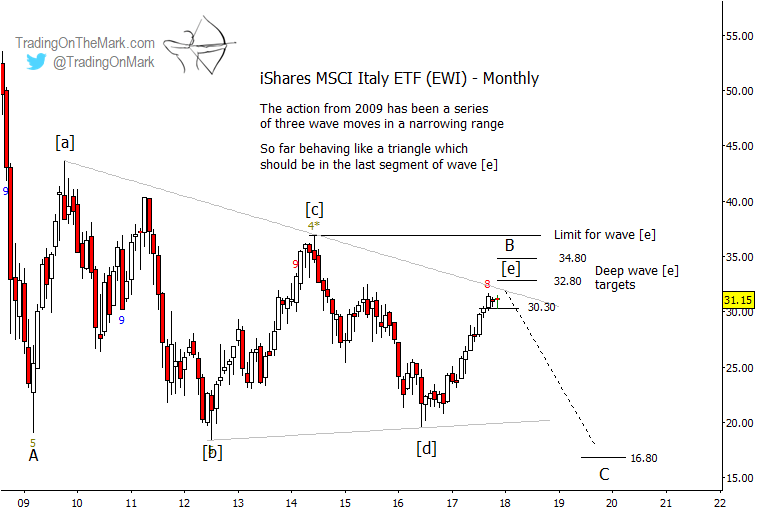
Also on the monthly chart, we see that the Wave59 proprietary “nine-five” wave counting indicator suggests the current upward move is near a potential area for completion. The indicator gave a similar reversal signal at the 2014 high.
If price falls out of the triangle as we expect, then the ideal target area for the declining wave ‘C’ would be near a Fibonacci 0.618 multiple of the earlier decline that we have labeled as ‘A’. That would put support near 16.80, representing approximately a halving of share value for the fund.
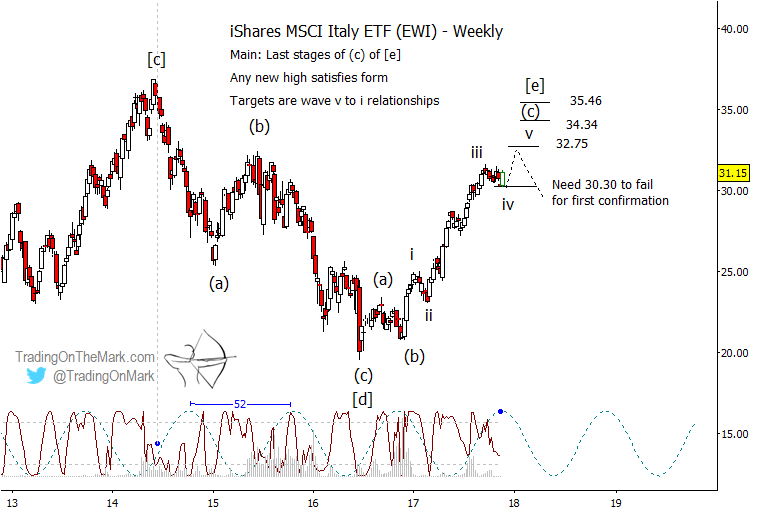
A closer examination of the structure of wave [e] of the triangle yields three main areas to watch where the magnitude of wave ‘v’ of (c) of [e] would have a Fibonacci relationship to the earlier wave ‘i’ of (c) of [e]. Likely resistance areas to watch on that basis include 32.75, 34.34, and 35.46.
It’s also important to note that the prevalent 52-week price cycle in EWI predicts a downward turn (or at least a pause) around now. A brief continuation upward to complete the move would not be incompatible with that cycle, since a strong completion move can sometimes push cycle timing rightward on the chart.
Our analysis emphasizes the S&P 500, bonds, crude oil, gold, the Euro, and the Dollar Index. WE also periodically cover other currencies, stock indices, and associated ETFs, and our new site design makes it easier than ever for subscribers to find the charts that are important for them.
This month we’re offering a special 15% price reduction for all Daily Analysis and Intraday Analysis subscriptions. Just use the coupon code U301 to apply your discount.