There are good reasons to watch for a decline in gold mining stocks during the next several months, and the trade might be easier than trying to catch a move in actual metal prices. Here we examine a monthly chart for the VanEck Vectors Gold Miners ETF (NYSEArca: GDX), which looks as though it should reach down to probe support near its 2016 low.
We’re also working on a more detailed weekly chart for this move. It should be finished soon and will appear in our newsletter this weekend. If you aren’t already receiving our newsletters, you can request your copy here.
Based on the structure of the GDX decline from 2011 to 2016, there could be another low in store. Our primary count has price moving down in diagonal wave [v] of a large five-wave sequence. For readers looking for a relatively quick trade of a few months, nearby Fibonacci resistance at 26.75 might serve as a backstop for short trades to catch the middle wave (iii) of [v].
For patient traders working with a longer time horizon, the eventual lows from the current pattern will probably represent an important value buy. The drawback is that the area near the anticipated low might need to be tested more than once, especially if the decline consists of five small waves as we expect.
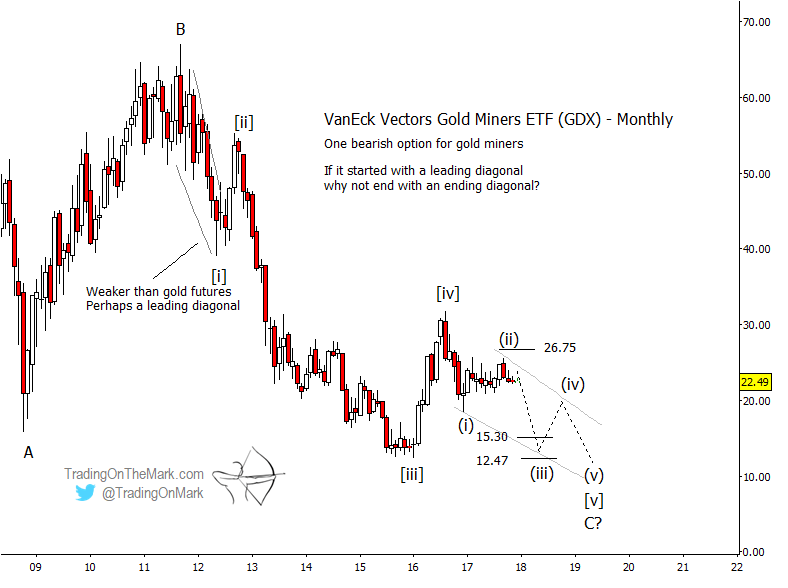
Normal Fibonacci targets for downward wave (iii) of a diagonal are near 15.30 and 12.47. The zone between those levels would represent a good exit if the downward trade works as it should.
Keep in mind that there is no guarantee that the larger pattern down from 2011 must consist of five waves, even though we think that is the most probable interpretation. The alternative would be for price to move upward from the 2016 low in a three-wave or five-wave formation that could last a year or more. A breakout above 26.75 would be the first indication that the bullish scenario might be gaining traction.
Our analysis emphasizes the S&P 500, bonds, crude oil, gold, the Euro, and the Dollar Index. We also periodically cover other currencies, stock indices, and associated ETFs, and our new site design makes it easier than ever for subscribers to find the charts that are important for them.
This month we’re offering a special 15% price reduction for all Daily Analysis and Intraday Analysis subscriptions. Just use the coupon code U301 to apply your discount.