Following our post about the Yen ETF earlier this week, next up on our trader’s radar is the Euro/Dollar currency cross. While the Yen is resting heavily on support, the Euro is approaching a critical resistance area. We believe the Euro will resume its decline from nearby, but we are also watching an alternate bullish scenario.
Our newsletter covers this and other “start of the year” forecasts in more detail. Request your copy here.
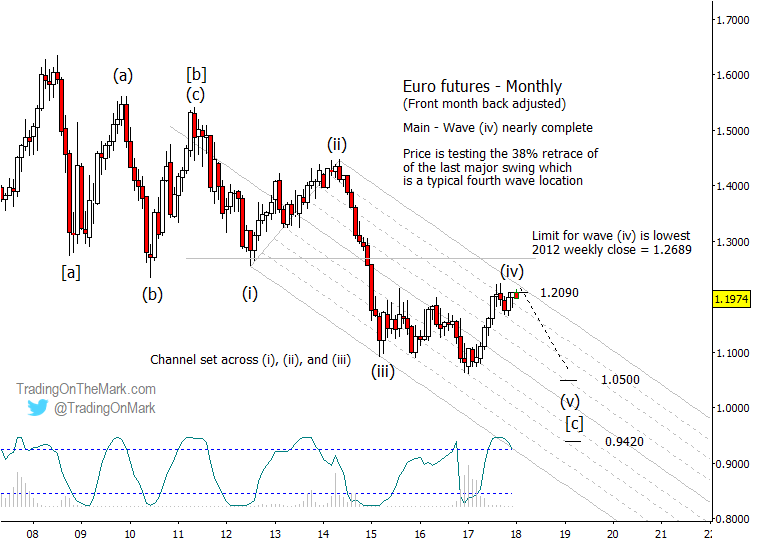
Euro futures have begun to acknowledge resistance near the area we identified last August for the related ETF. Our main scenario has price declining in an impulsive pattern from the high of 2011. For our main scenario to work, corrective wave (iv) cannot reach above the 2012 low of approximately 1.2689 (based on weekly close), and we would prefer to see the channel boundary put a cap on the move beneath that level. As a typical Fibonacci retracement, the 1.2090 area is prominent resistance.
If price turns downward in sub-wave (v) of [c] in our main scenario, then likely Fibonacci targets for completion of the move lie near 1.0500 and 0.9420 on a monthly chart. We will be able to refine the targets better when there is more price action to serve as the basis for measurements on weekly and daily charts.
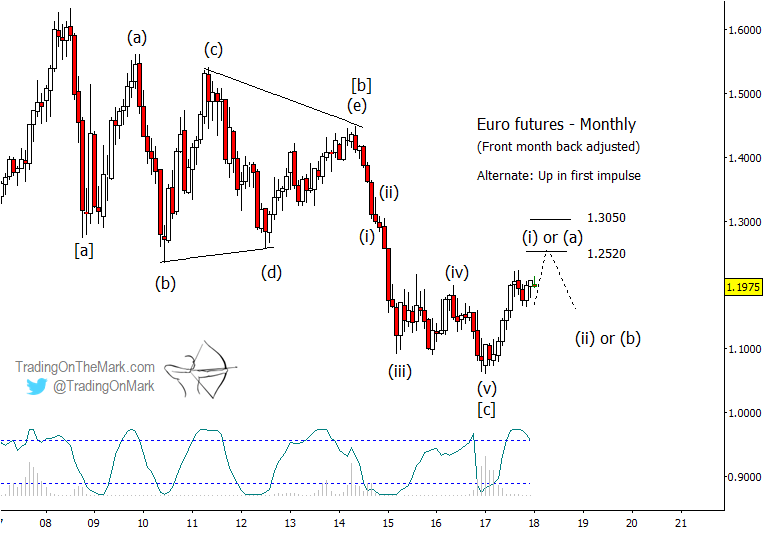
The alternate, bullish view for the Euro has a downward impulse from 2014 already completed, with price now rising out of a durable low as wave (i) or (a) to approach the first main resistance areas near 1.2520 and 1.3050. However this scenario runs counter to our main Elliott wave and cycles analysis for the Dollar Index.
As mentioned earlier, the primary bearish scenario for the Euro cannot be ruled out unless the futures price crosses above the 2012 low. That leaves some room for ambiguity that could persist through the early part of 2018, with the primary and alternate patterns competing until one is invalidated. Our subscribers benefit from a closer analysis of weekly and daily charts that can provide confirmation signals about which scenario is working.