The Yen ETF poked a little bit above the consolidation range that it formed during the past year, which is a signal that bears should be cautious. However we believe the most likely path is downward from here. This post shows two ways a decline might play out in the CurrencyShares Japanese Yen Trust (NYSEArca: FXY)
We’re also announcing a special subscription offer this month, with details at the end of this post.
In January we suggested that traders should watch for the FXY consolidation to break downward. The clearest signal that one of our two bearish scenarios is working will be a break of the supporting trend line shown on the monthly chart below.
Even prior to a confirming break of the supporting trend line, traders should note that FXY is testing a resistance zone this month near 90.80 and 91.50 that represents a Fibonacci 61.8% retracement of the downward move during 2016 and a 1×1 move up from the late-2016 low. The next higher Fibonacci retracement level is near 93.20, but price may not reach that high before a downward trend kicks in.
Our main scenario views the rally from late 2016 as a wave (ii) retracement in an overall downward sequence of five moves. Our alternate scenario views the same rally as wave (b) in a downward sequence of three moves. In both cases the near-term trade would be downward.
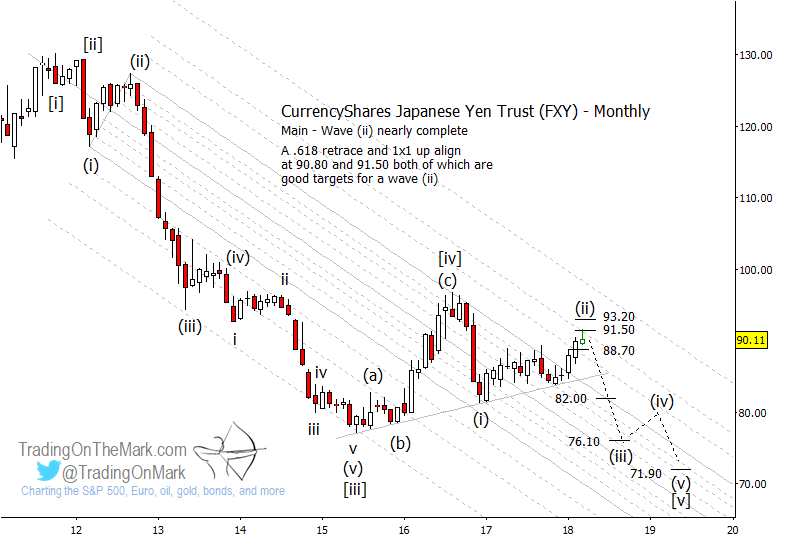
If FXY is making a five-wave impulsive move down from the 2016 high, and if it declines from near is present area, then a likely Fibonacci extension target for wave (iii) in that pattern is near 76.10 on a monthly chart. The same method shows higher support at 82.00 that might produce a pause, but we think it probably will break. Wave (iii) should reach beneath wave (i).
It’s even possible that wave (iii) could test a lower Fibonacci support at 71.90, although that could instead become a target for wave (v) later.
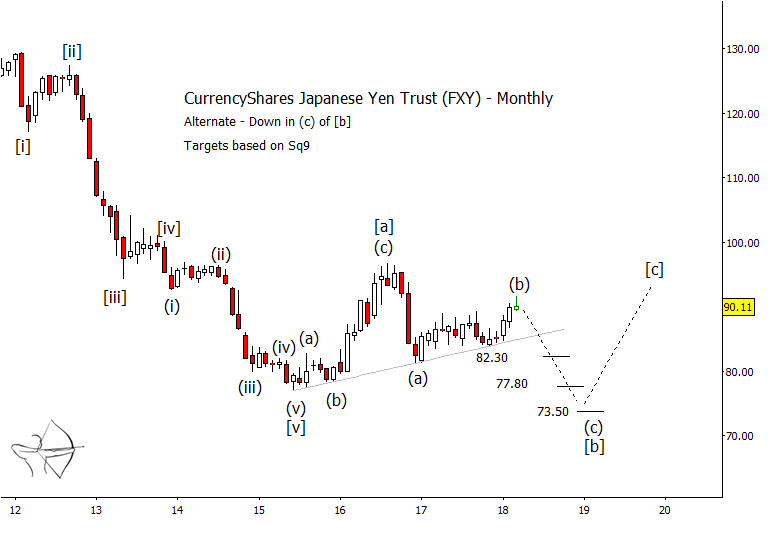
In an alternate scenario where the current high represents wave (b) retracing the downward move (a) from 2016, the next trade would still be downward. In this scenario, downward wave (c) of [b] is not required to go beneath the late-2016 low of (a), but it probably would do so.
We have drawn Gann square-of-nine support levels on the alternate chart at 82.30, 77.80, and 73.50 because Gann levels generally work well with FXY. However, the sets of Fibonacci and Gann supports are both equally relevant to both the main and alternate scenarios.
Subscribers to TOTM’s services get daily chart updates with this type of analysis for a variety of markets including the S&P 500, crude oil, gold, the Euro, the Dollar, and bond futures. There’s an option for intraday trading support too. By acting now you can take advantage of a special offer this month to lock in 15% savings permanently on any of our services.