With two strongly declining months in a row, the British Pound appears to be embarking on the decline we forecast in our post last November. These charts for the CurrencyShares British Pound Sterling Trust (NYSE Arca: FXB) show where price is probably headed and where to look for the trades.
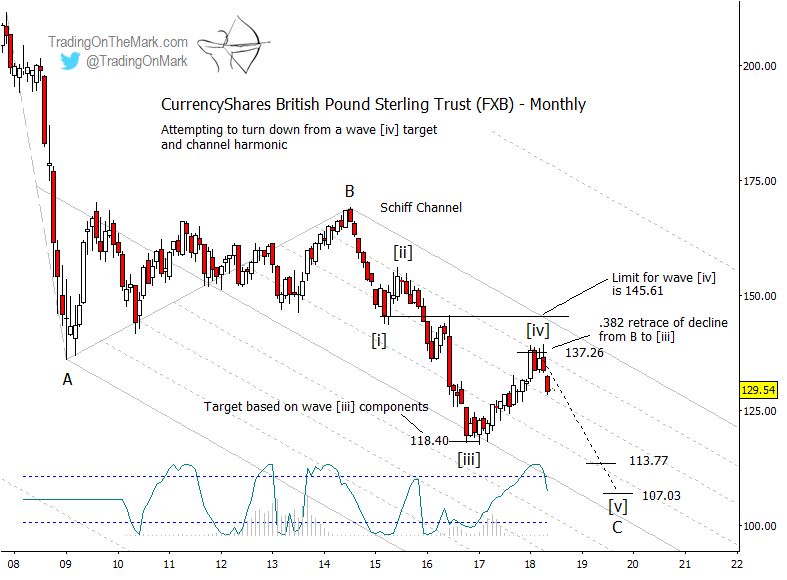
In the big picture, we’re watching the progress of a five-wave impulse down from the 2014 high — a move that should represent the final wave ‘C’ of a decade-long correction. We are counting the upward retrace from 2017 as the fourth wave of that sequence.
Even though wave [iv] broke through the initial resistance level we highlighted in our earlier post, it nevertheless met a ceiling at the Fibonacci 38.2% retracement of the entire move down from ‘B’. That combined with the strong downward reaction is probably sufficient to confirm that upward wave [iv] is complete, but the absolute limit for wave [iv] would be 145.61, or the monthly close representing the end of earlier wave [i].
The main downward targets on this macro scale include standard Fibonacci extensions of wave [v] versus wave [i] at 113.77 and 107.03.
Even though we believe downward wave [v] has begun, the first step of that move might be nearly complete. That suggests traders who are already short might lock in some profits while others might wait for a fresh opportunity after a minor upward retracement. Some Gann-related resistance levels to watch during a retracement include 131.43, 134.04, and 135.34.
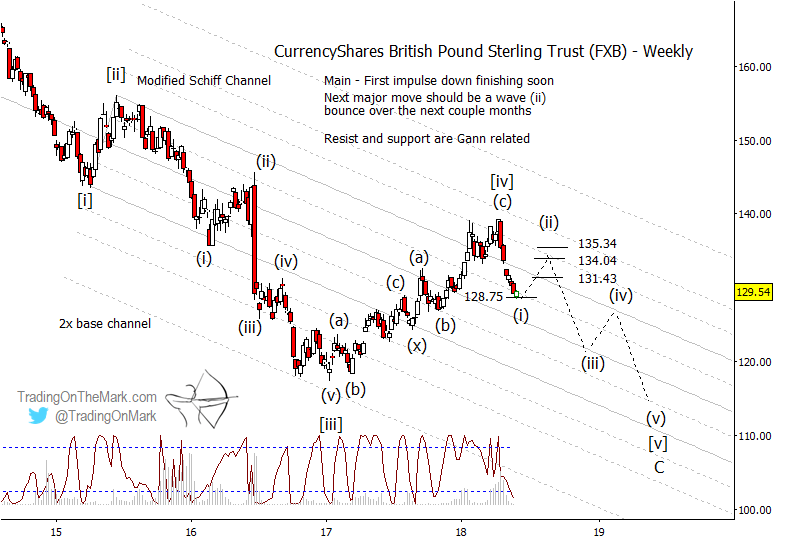
Eventually a series of lower highs and lower lows should carry FXB beneath its 2017 low as suggested by the earlier monthly chart. Cycles analysis with futures prices forecast the next cycle lows to occur in December 2018 and near the end of summer 2019.
Trading on this time scale requires patience, but the payoff can be impressive after lengthy moves. This is the pace that might suit a part-time trader or a full-time trader who is taking a lighter approach during the summer months. Right now we’re making a special subscription plan available with those types of traders in mind.
Take out a year-long subscription to TOTM’s Daily Analysis service (charts every trading day for a wide range of markets), and we’ll deduct the cost of three months of service. Basically you get a whole summer of charts for free! The coupon code to take advantage of this offer is “summer”.
TOTM’s Daily Analysis includes charts every trading day for the S&P 500, crude oil, the Euro and Dollar Index, treasury bonds, and gold.