The downward move in copper prices that began early this year should be able to reach considerably lower. From an Elliott wave perspective, the decline so far has only put in the first leg of an expected three leg move.
As price nears a prominent retracement value at 2.62, traders with short positions might wish to manage their trades or prepare to ride through a modest upward correction.
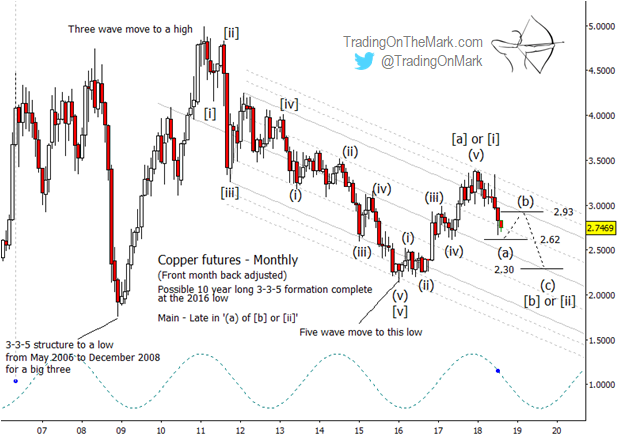
For the purpose of planning trades, it makes sense to pay attention mostly to price action that occurred after the January 2016 low. We believe that moment represented the end of one major pattern that had lasted since 2005 and the beginning of a new pattern.
It is not yet clear whether the new pattern that began in 2016 is overall corrective (consisting perhaps of an [a]-[b]-[c] structure) or impulsive (manifesting as a forceful upward [i]-[ii]-[iii]-[iv]-[v] move). It’s a good rule of thumb that most of the large-scale Elliott wave patterns in commodities that develop during one’s trading lifetime are corrective when you step back far enough to see the big picture.
If price bounces from near the 2.62 area, it will be important to watch how it behaves if it tests the broken support, now resistance at 2.93. That resistance could send price back downward in sub-wave (c) of the move that began this year.
Note that it will be possible for sub-wave (c) to reach beneath the January 2016 low. If that occurs, it will confirm that the current large-scale pattern that began after that low is in fact corrective, not impulsive.
The dominant 40-month price cycle suggests that the downward move that is wave [b] or [ii] should persist until approximately the middle of 2019. An 87.5% retracement level at 2.30 represents a preliminary area to watch for support when the move completes, and we will be able to make a more precise forecast after additional turns have printed on the chart.
Trading On The Mark offers morning and evening updates every trading day, on time frames ranging from weekly to intraday for the S&P 500, crude oil, the Euro, Dollar Index, treasury bonds, and gold.
This summer, we’re making a special offer available for extra savings. Take out a year-long subscription to our Daily Analysis service and we’ll deduct the cost of three months of service. Basically you get a whole summer of charts for free! The coupon code to take advantage of this offer is “summer”.