We recently posted a chart at our website showing a bearish forecast for copper futures heading into 2019. In that context, there should be some opportunities coming soon with the related mining fund, the Global X Copper Miners ETF (NYSE Arca: COPX).
As a rough approximation, an eventual target for the decline might be near the Fibonacci 61.8% retrace of the move up from 2016, or near 16.74. That would represent a decline of more than 20% from the fund’s current value.
However COPX first has to break beneath the 38.2% retracement at 21.58, and it might not do that until it has finished tracing waves (a) and (b) shown on the monthly chart below.
If price puts in a bounce soon, Fibonacci retrace resistance at 26.43 might be a good area to watch for upward correction (b) to end and downward wave (c) to start.
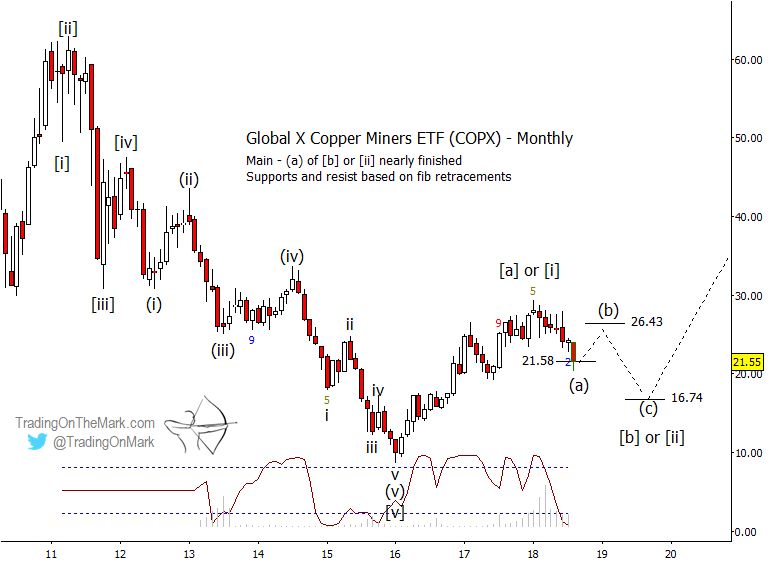
The path we have drawn on the monthly COPX chart approximately corresponds to the cycle timing on the monthly chart of copper futures we mentioned earlier. By that method, we would expect an important low around the middle of 2019.
The weekly chart below offers some refined targets for a bounce if the nearby support at 20.82 holds. The first resistance to contend with should be near 22.65, with higher targets at 24.11 and 25.25. The upward move during the next several months will probably be choppy, making long trades difficult unless you are operating on a relatively fast time frame.
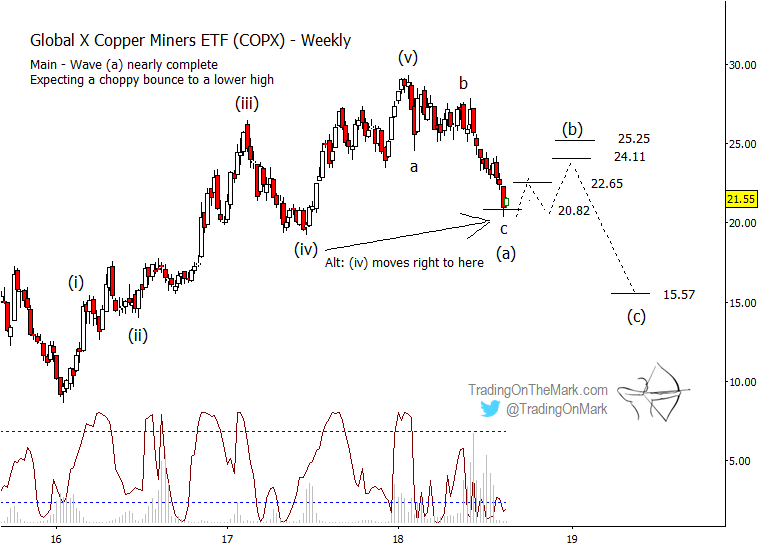
Note that our alternate Elliott wave count for COPX has the current low as corrective wave (iv) rather than wave (a) of a larger pattern. In that case, COPX would reach for a new high over that of January, but we believe the scenario is less likely.
There are still a few days left for traders to take advantage of our special summer offer and see deep savings on a year-long subscription. You’ll get morning and evening updates every trading day on time frames ranging from weekly to intraday for the S&P 500, crude oil, the Euro, Dollar Index, treasury bonds, and gold. Start the fall trading season with an advantage!