This is why we have been telling subscribers not to jump onto bearish positions too quickly. Until we see a real breakdown of support, along with a series of lower highs and lower lows, the trend (the trader’s friend) is still upward.
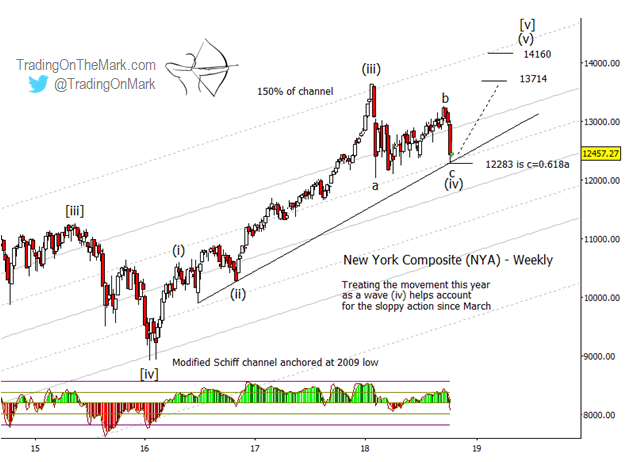
Looking at a multi-year chart of the New York Composite Index (NYA), we see that despite putting in a lower high last month, the series of important lows during the past year still represents a rising series of supports.
Moreover, the form of price action during the past year has been exactly what an Elliott wave technician would ask for, with wave ‘c’ of a correction stopping at the Fibonacci 0.618 measurement relative to wave ‘a’.
Simultaneously with the appearance of Fibonacci support, NYA encountered the prominent trend line shown on the weekly chart here. There were several reasons for buyers to step in right at that spot.
In volatile conditions, traders of all experience levels can benefit from charts that show the areas where turns are more probable. Trading On The Mark helps subscribers stay on top of the moves with twice-daily updates for the Dollar Index, Euro futures, the S&P 500, crude oil, treasury bonds, and gold.
Between now and October 31, new subscribers can lock in savings of 15% on all of our services. The coupon code for the special offer is “fractal”.
Consistent with the charts we’ve been posting for some time, we believe the indices are reaching for a top that may not be far away now.
Even so, the recent erasure of the 2018 gains looks to us like a typical fourth wave correction in the (i)-(ii)-(iii)-(iv)-(v) sequence we have been counting upward from the 2016 low.
The first thing that would lead us to reconsider and favor a bearish bias would be a decisive breakdown of the trend line and Fibonacci supports we mentioned. An upward retest of the broken supports followed by another downward move would probably confirm the bearish view.