In the four weeks since our November 23 post, the United States Oil Fund (NYSE Arca: USO) has ventured into the support zone we identified between 11.54 and 10.83. It can go a bit lower, but it doesn’t have to.
As we mentioned previously, crude oil and USO have put in a three-wave a-b-c corrective move in which the middle ‘b’ wave represented the actual price high and the ‘c’ wave was the very strong decline. Even though the correction has put in three waves, we believe it probably is not finished. Cycles on our monthly charts (not shown) suggest that a longer correction is more likely. In that scenario, the a-b-c that has already printed on the chart probably represents just the first segment of a larger (a)-(b)-(c) correction.
For now, traders should think of the Fibonacci-derived support area at 10.83 as an opportunity to take profits, even though there is a chance the next support at 10.25 could be tested.
When a bounce kicks in, similar Fibonacci resistance levels to watch will be near 13.33 and 13.95. However as we cautioned in the previous post, a bounce is likely to be choppy. Any traders hoping to benefit from long positions will need to be careful with entries and also be patient in waiting for a good return.
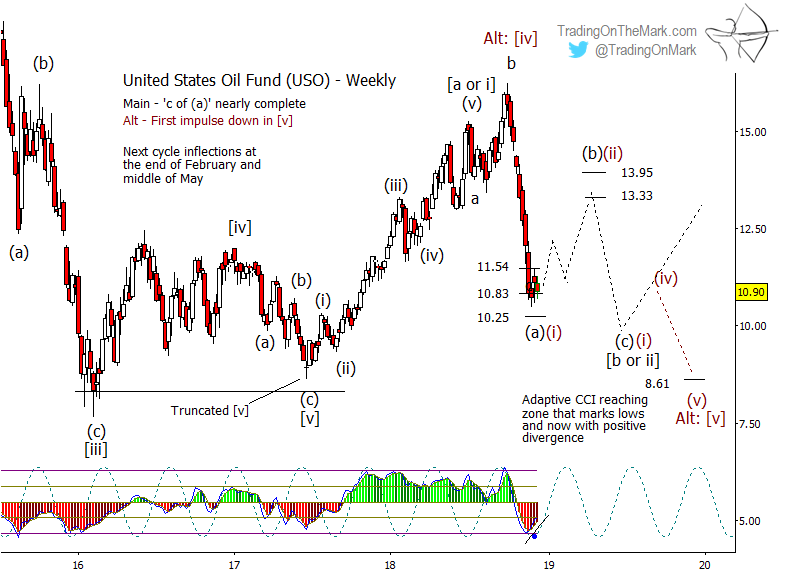
With the corrective (a)-(b)-(c) structure that we expect to see continuing into 2019, wave (c) probably would represent a new low beneath the current price, although that is not a certainty.
There is also a possibility that oil prices could be making an impulsive move down from the recent high, in which case we would see a test beneath the 2016 low. We regard that as less probable and have shown the alternate scenario with red labels in the chart above.
Let us help you stay on top of the moves all through the next year. During this holiday period you can lock in 25% savings on 12 months of our Daily Analysis service or our Intraday Analysis — just use the code “reindeer” when you sign up.
Happy holidays to you from Tom and Kurt at Trading On The Mark!