In early September, we wrote about a countertrend bullish opportunity with Brazilian Real futures. As expected, the support we showed at 0.2404 produced a nicely bounce to test broken supports, now turned into resistance.
The bounce even reached slightly beyond the 14% price increase we had projected, although the market is now acknowledging the resistance area marked by a Fibonacci retracement at 0.2679 and a Gann-related level at 0.2817.
Volatility is increasing across all of the market sectors we watch at Trading On The Mark. We can help you prepare for the 2019 trades with a whole year of chart support, and right now you can lock in a year of deep 25% savings with the special subscription package offered at our website.
With resistance tested, we expect the larger downward trend to take charge again. The Elliott wave structure of the decline from 2011 calls for an impulsive [i]-[ii]-[iii]-[iv]-[v] sequence to reach a new low. The more recent decline since 2017 probably represents the concluding fifth wave of that sequence.
Conservative bears might watch for a better test of 0.2817 as resistance. Adventurous bulls might even view that level as a near-term target for a relatively quick upward trade, although they would have to monitor charts that are faster than the one shown here. Neither party should view another test of 0.2817 as guaranteed through.
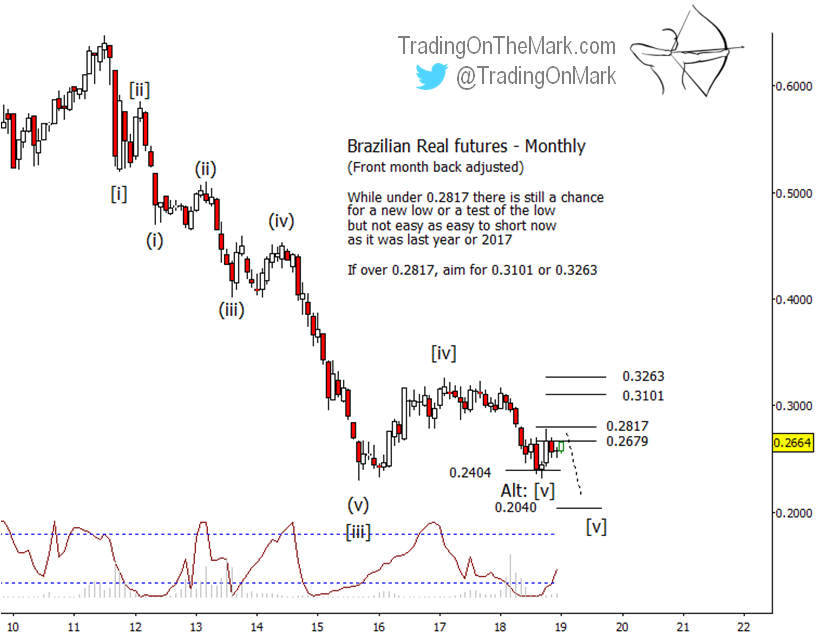
Even though we still believe the favorable trending trades are downward, potentially bearish traders should note that the September low met the minimum criteria for completion of downward wave [v] by reaching a lower monthly closing price. This is a good time to make a contingency plan in case the chart prints a higher low and shows an upward breakout above resistance. In that alternate scenario, a break above 0.2817 would probably lead to a test of Fibonacci extension levels at 0.3101 or 0.3263.
If the main, bearish scenario continues to hold, then a Gann level at 0.2040 probably represents the next support area to be tested during a continued decline. That area probably represents a good opportunity for a “value buy” as well.