When we wrote about the U.S. Dollar ETF in October, we indicated a preference for the scenario with a modest downward retrace. That retrace occurred, taking price down to test the midline of an upward-sloping channel.
The chart below shows monthly candles for the Power Shares DB US Dollar Bullish ETF (symbol UUP). Consistent with our long-term upward count of an impulsive move from the 2011 low, we are treating the early-2018 low as wave [iv] in the structure. Note, there was no substantial overlap between wave [iv] and wave [i].
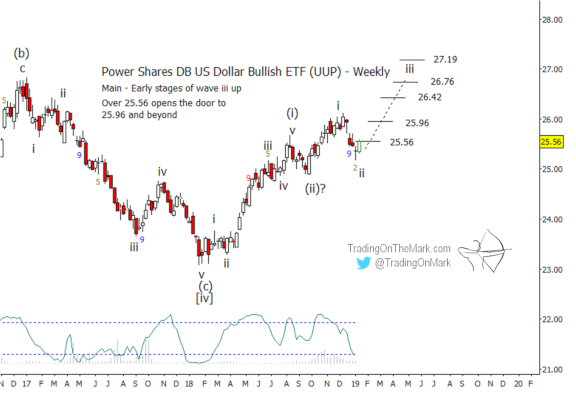
We believe UUP has been climbing in large wave [v] since the start of 2018. In order to highlight the best solutions for resistance during the next stages, we have anchored the aforementioned channel on waves [i], [ii], and [iv].
Within wave [v], it is possible to identify targets for subwave (iii) based on Fibonacci relationships with subwaves (i) and (ii). Those measurements put likely resistance areas near 26.50 and 26.87. Note that the higher of those levels will coincide with a test of the channel’s upper boundary later this year.
Our upcoming post at See It Market will show how the climb might look on a weekly chart, with key areas for traders to watch.
Follow Trading On The Mark on Twitter for more frequent updates about ETFs and futures!