The British Pound has fell nicely away from the resistance level we charted here seven months ago. Now that we are starting to see a bounce in the wake of the failed Brexit vote, it’s time to reassess the downward trend and look for the areas where the next opportunities await.
Here we show the next leg of the forecast in the context of the CurrencyShares British Pound Sterling Trust (NYSE Arca: FXB).
We still believe FXB is tracing a five-wave decline from its 2014 high, with the more recent high in summer 2018 representing wave [iv] of that sequence. The implication is that the decline from last April also should consist of five waves on a smaller scale, which will be labeled eventually as (i)-(ii)-(iii)-(iv)-(v) counting downward from [iv].
The decline from summer into autumn was so steady that it should be considered as a single move – wave (i) in the expected five-wave decline. With that wave apparently complete in mid-August 2018, we are now watching for corrective wave (ii) to finish its consolidation as a prelude to another strong decline in wave (iii).
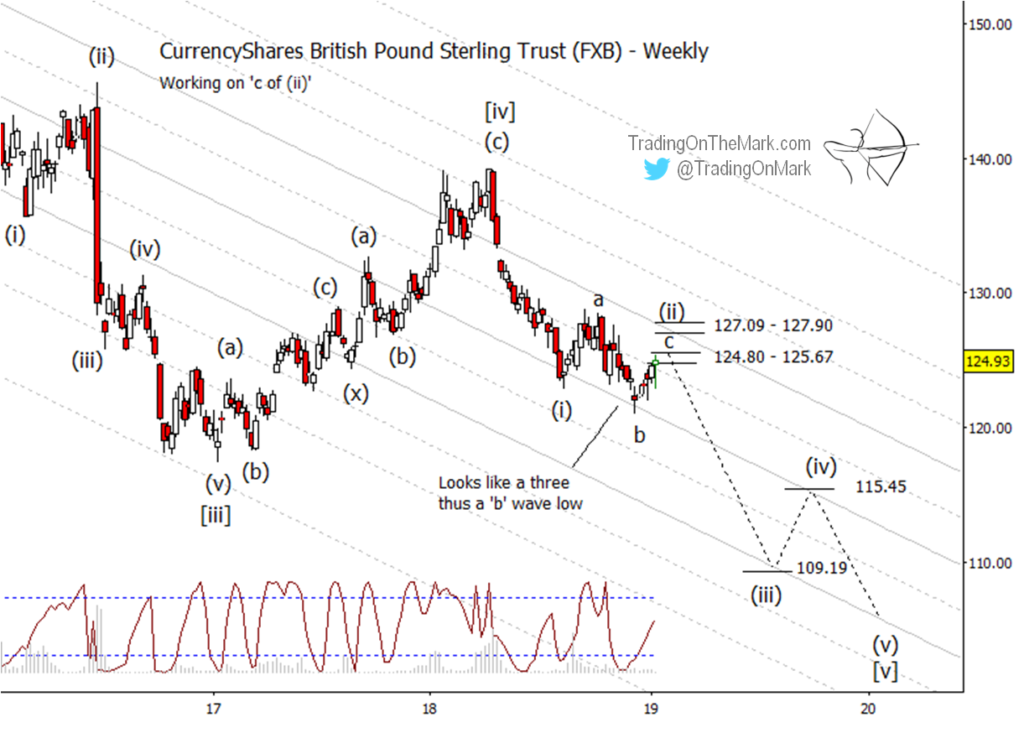
Looking ahead, the resistance zone near 124.80-125.67 represents the first area where small sub-wave ‘c’ of (ii) could end. If price breaks above the first resistance zone, then the next likely area for a downturn is near 127.09-127.90.
Once the decline resumes in FXB, an approximate initial target for wave (iii) lies near 109.19 based on a Fibonacci extension measurement. We probably will be able to refine that target after it is clear that wave (ii) is complete.
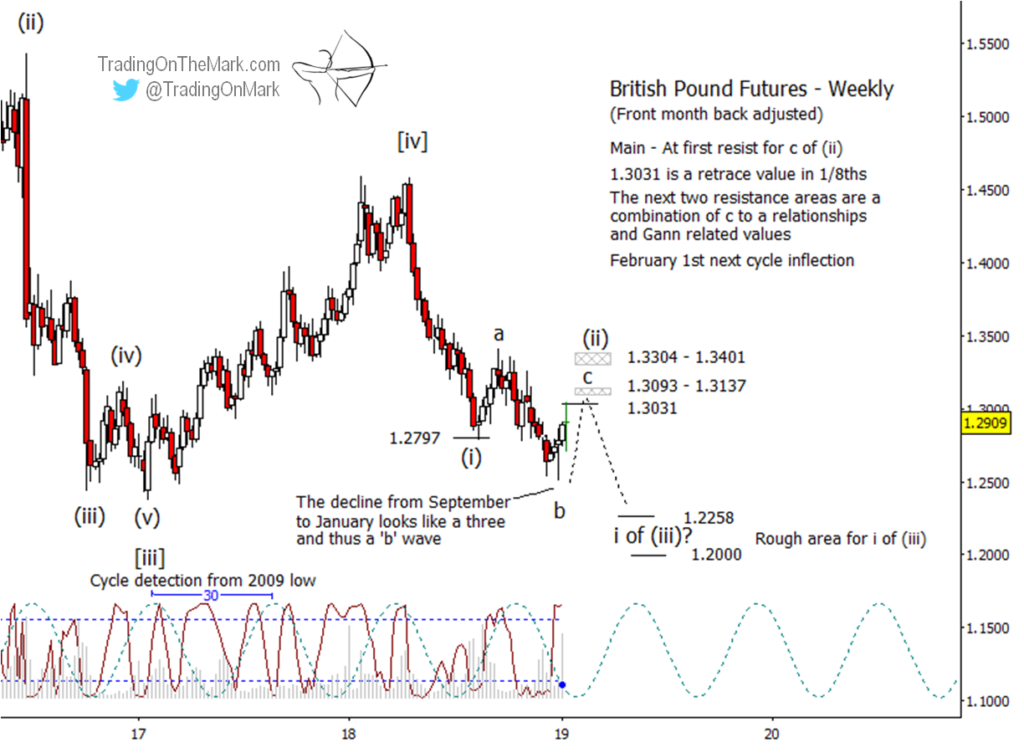
In the context of futures prices some resistance levels stand out, with the first level at 1.3031 representing a one-eighth retrace. Beyond that, the there are clusters of resistance values around 1.3093-1.3137 and 1.3304-1.3401 based on Gann measurements and on Fibonacci relationships among the internal sub-waves of wave (ii).
Once the decline resumes, an approximate initial target for the next downward leg lies near 1.2258, perhaps followed by a test of support near 1.2000. We will be able to refine those targets after it is clear that wave (ii) is complete.
It’s worth noting that the 30-week price cycle is about to undergo an inflection. That event might coincide with a price high, possibly allowing the larger decline to resume within just a few weeks.
Follow Trading On The Mark on Twitter for more frequent updates about ETFs and futures!