In August we posted a chart showing that copper futures were approaching a likely support around 2.62. Then in November we posted a follow-up showing how a bounce might be forming on top of that support. The bounce occurred as expected, and now it is nearing the first significant resistance.
The downward-sloping channel we showed on a monthly chart in November is still valid, and price is testing the channel’s upper boundary now. However a chart with weekly candles allows for a more precise calculation of resistance areas in a way that is useful to Elliott wave traders.
Based on relationships to recent waves ‘a’ and ‘b’, traders might watch for the current upward swing ‘c’ to conclude near 2.85, 2.93 or 3.03. We note that the Lomb periodogram (a method of detecting price cycles) has breached the upper threshold, suggesting that a price high may occur soon.
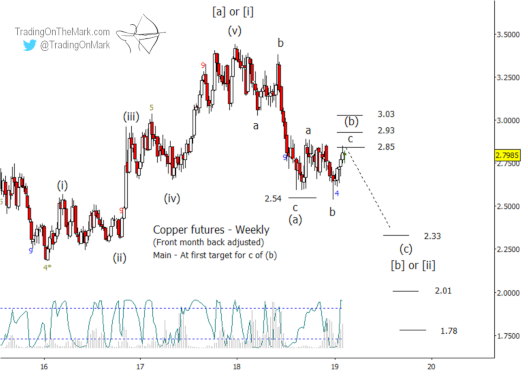
Estimated targets for a strong downward wave (c) sit at 2.33, 2.01 and 1.78 based on a relationship with earlier wave (a). Those estimates are only preliminary at this point, because the current small a-b-c corrective pattern has not yet proved to be complete.
There are clues on a daily chart (not shown) that help gauge the maturity of the current bounce, which is upward sub-wave ‘c’ of (b). Those charts are available to subscribers.
Note, an alternate interpretation of the corrective action since mid-2018 might view the small up-down-up move as merely the first part ‘a’ of a more prolonged correction. That scenario cannot be ruled out until price breaks decisively beneath recent lows.
Follow Trading On The Mark on Twitter for more frequent updates about ETFs and futures! In coming days, readers of our free emailed newsletter will also receive exclusive content and opportunities to save on TOTM subscription packages.