This post is exclusively for readers of our emailed newsletter. It features an updated version of the weekly timeframe analysis of copper futures that we posted for the general public on February 22.
We also show what the opportunity looks like based on charting copper futures on a daily time frame, and we examine the implications of the main and alternate scenarios for the largest copper mining ETF.
Also just for our email readers, there’s an exclusive way to cut the cost of any month-by-month subscription at Trading On The Mark. It’s described at the end of this email.
The main copper scenario has us looking for a strong downward move from resistance.
In August we posted a chart showing that copper futures were approaching a likely support around 2.62. Then in November we posted a follow-up showing how a bounce might be forming on top of that support. The bounce occurred as expected, and now it is poking slightly through the second resistance level.
Based on relationships to recent waves ‘a’ and ‘b’, traders working on a weekly time frame might watch for the current upward swing ‘c’ to conclude near 2.93 or 3.03. We note that the Lomb periodogram (a method of detecting price cycles) has breached the upper threshold, suggesting that a price high may occur soon.
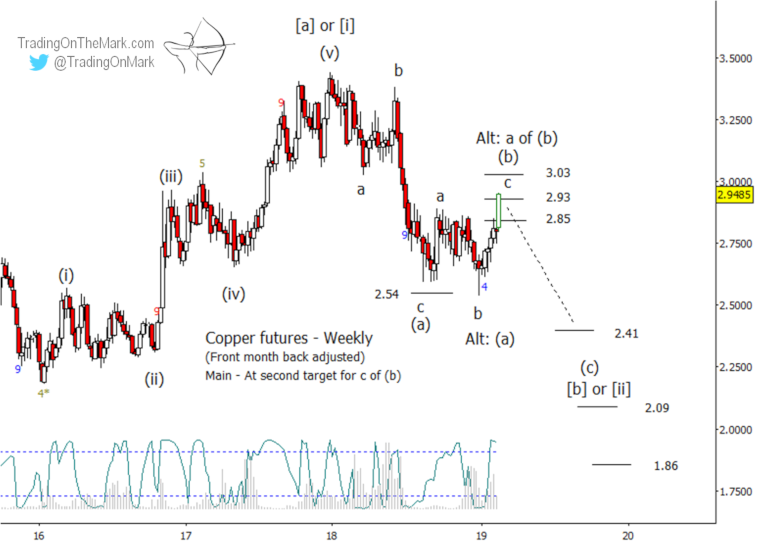
Still working with weekly candles, preliminary targets for the strong downward wave (c) sit near 2.41 and 2.09 based on a relationship with earlier wave (a). The next support area near 1.86 is worth keeping in mind as a stretch target, and we’ll be able to assess it’s viability when there is more price action printed on the chart.
The ETF chart shows how an alternate scenario might work.
Our main Elliott wave scenario has wave (c) dropping from near the current area. That’s the scenario shown on the weekly futures chart above, and it’s the first path drawn on the copper miners ETF chart below.
As an alternate scenario, the up-down-up moves since mid-2018 could represent just the first part of a more prolonged correction. In that case, any downward turn from near the current area would not drop far, and we would expect to see additional choppy, rising action for several more months. That’s the second path drawn on the COPX chart below, and it would look similar on a copper futures chart.
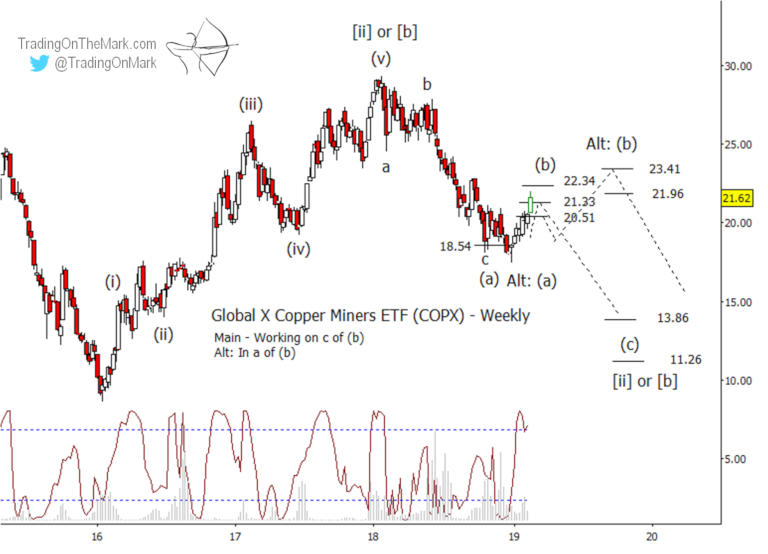
Specific resistance levels for COPX based on the main scenario include 21.33 and 22.34. If price does not fall away from that area, then we would start watching for a prolonged correction to drift into resistance near 21.96 or 23.41 following the alternate path.
A daily chart offers more guidance.
The upward move of January and February looks more impulsive than corrective. That lends some favor to the main scenario in which the copper correction is reaching an end and preparing for a strong decline. In the context of the main scenario, the correction consisted of small waves ‘a’, ‘b’, and ‘c’ to form larger corrective pattern (b).

Some nearby resistance areas to watch on a daily time frame that could produce a reversal include 2.97 and 3.02. Although it is often a good strategy to place entry orders close to the target levels, confirmation that the trade is actually working usually comes with a break of an important line such as the resistance-turned support at 2.89.
You’re trading with an advantage when you have up-to-date charts. A Daily Analysis subscription at TOTM gives you constant access to up-to-date with charts on weekly and daily time frames for the Euro, the Dollar Index, gold, crude oil, bonds and the S&P 500. Right now you can try that subscription for a month at a substantially reduced price.
We’re making this offer available exclusively to readers of this newsletter. Check out the Subscribe page at Trading On The Mark and use the coupon code “EXCLUSIVE” to cut 15% off the price. The special offer works for our Intraday Analysis too, in addition to Daily Analysis.
Good fortune to you in your trading!
— Tom and Kurt at Trading On The Mark