This post with exclusive charts and content is just for readers of our emailed newsletter. It shows how the Yen and the related ETF appear to be on the verge of breaking out of a multi-year triangle consolidation.
Also just for our email readers, there’s an exclusive way to cut the cost of any month-by-month subscription at Trading On The Mark. It’s described at the end of this email.
The Yen is very close to the lower edge of the range
The bounce in the Yen that we forecasted in August now appears complete. Next we expect a fairly strong downward thrust that should take price to a new low.
Our main Elliott wave scenario for the Yen continues to feature a fourth-wave triangle consolidation that is part of a larger five-wave impulse down from the 2011 high.
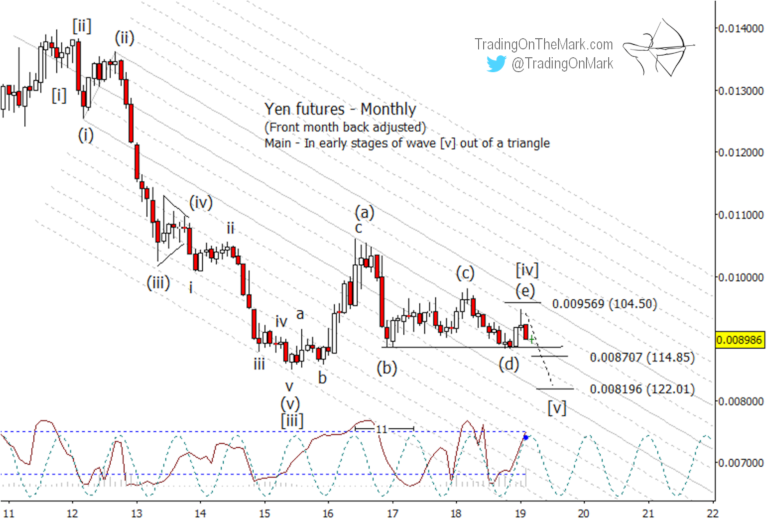
The final wave (e) of [iv], which is the bounce we discussed in August, did not quite reach the original target of 0.009569 (inverse of 104.50). However the upward structure of (e) appears complete on a weekly time frame.
The first confirmation that price is breaking out of the triangle will be a breach and monthly close beneath the area of earlier wave (b). However the break itself might not represent the best entry opportunity, because price can easily bounce into the triangle’s range again as a small wave (ii) of [v].
The Fibonacci-related supports at 0.008707 (inverse of 114.85) and 0.008196 (inverse of 122.01) represent likely targets for the downward components of expected wave [v] based on relationships measured on this monthly time frame. Similar support areas for the CurrencyShares Japanese Yen Trust (symbol FXY) sit at 83.07 and 79.25.
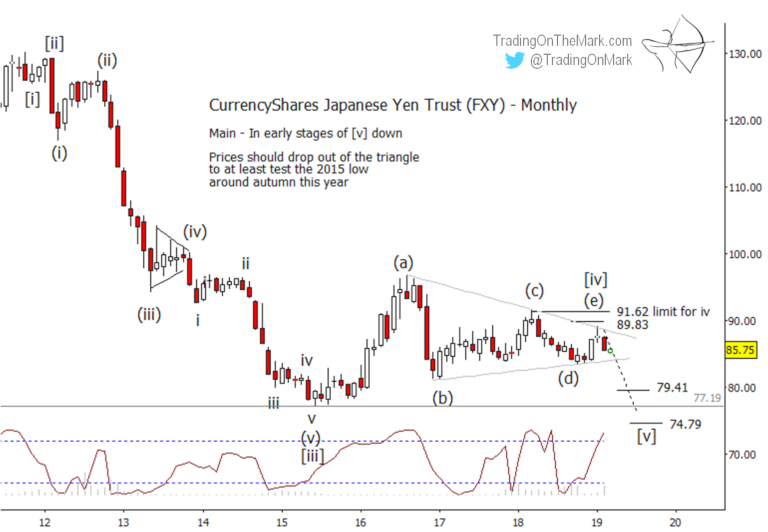
Similar support areas for the CurrencyShares Japanese Yen Trust (symbol FXY) sit at 83.07 and 79.25, as shown above.
The weekly charts favor the triangle being complete
Looking forward, there is more than one way for a declining wave [v] to play out. Here we use weekly charts for futures and FXY to show two different scenarios.
First scenario – a rapid departure from the range
If price breaks strongly beneath the lower range boundary at 0.008856 (inverse 112.92), one of the most prominent Fibonacci-related supports on a weekly time frame waits at 0.008609 (inverse 116.16). From there, a retest of the broken range boundary is possible, and that could represent an area to watch for a possible entry opportunity.
Other Fibonacci-related supports should act as stepping stones for a downward cascade that would visit 0.008362 (inverse 119.59) and 0.008107 (inverse 122.40).
An inflection of the 49-week cycle takes place near the end of August 2019, and that might provide approximate timing for the downward move to finish. However we will have to monitor it progress to see if that idea continues to look favorable. (The 49-week cycle on the chart below is the same as the 11-month cycle shown on the monthly chart at the top of this email.)
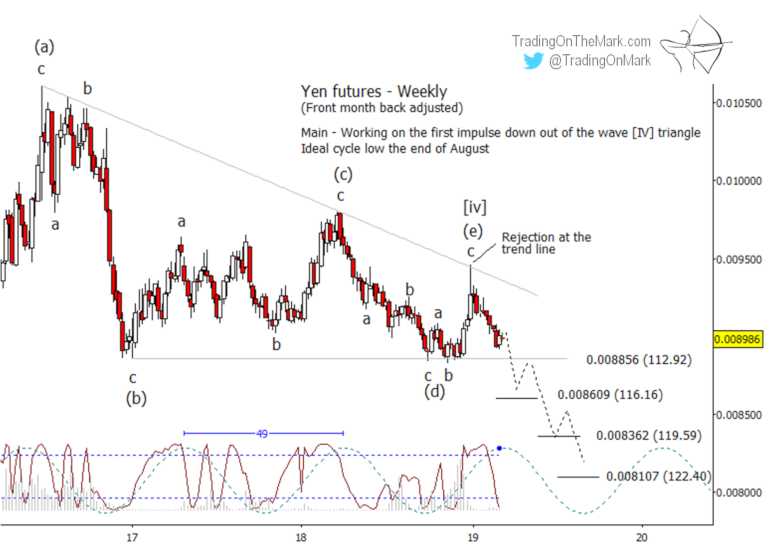
Note how perfectly the futures price and FXY tested and retreated from their respective trend lines that connected prior highs on the weekly charts shown below. That retreat further encourages the view that wave (e) of the triangle is complete.
Second scenario – a retest inside the range
Another possibility is that a weak thrust out of the triangle’s range can lead to a retest of the middle of the triangle’s range as a bouncy wave (ii) of [v]. A support at 83.07 represent one area where wave (ii) could start.
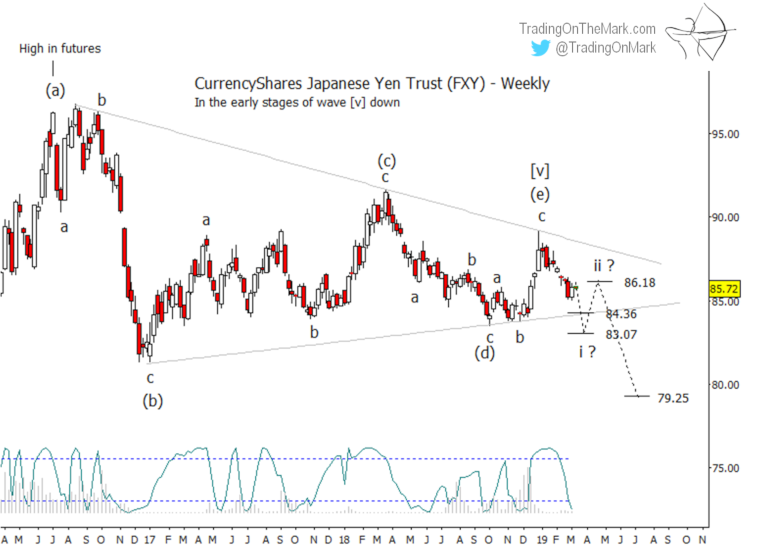
A more tricky version of this scenario might be a wave (ii) bounce from support at 84.36, which is still inside the range of the triangle. Sometimes a wave [v] after a triangle doesn’t actually break out of the range with sub-wave (i), but instead breaks out with sub-wave (iii).
Regardless of which scenario takes place, traders should watch another FXY support level at 79.25 as a possible target for one of the downward moves.
You’re trading with an advantage when you have up-to-date charts. A Daily Analysis subscription at TOTM gives you constant access to up-to-date with charts on weekly and daily time frames for the Euro, the Dollar Index, gold, crude oil, bonds and the S&P 500. Right now you can try that subscription for a month at a substantially reduced price.
We’re making this offer available exclusively to readers of this newsletter. Check out the Subscribe page at Trading On The Mark and use the coupon code “EXCLUSIVE” to cut 15% off the price.
The special offer works for our Intraday Analysis too, in addition to Daily Analysis. Use it any time before Sunday, March 17.
Good fortune to you in your trading!
— Tom and Kurt at Trading On The Mark