Exclusive update from Trading On The Mark
We haven’t posted any public articles about gold for more than a year because for us there weren’t any high-confidence forecasts of trending moves. The market is changing now, and we’re watching two potential scenarios for a breakout from the range of the past few years.
This update shows two scenarios for gold prices – a bearish one and a bullish one. Most importantly, we discuss the clues to watch for that may help traders discern which scenario is working.
We’re also trying something new this spring. Subscribers to our Daily Analysis often ask about what’s being discussed in the Intraday Service chat. If you’d like to find out whether the Intraday Service suits your trading style, see the final section of this email for an opportunity to try it with no extra cost.
Main scenario – a three-year triangle is most immediately bearish
The consolidation that began in 2015 has coiled up nicely, taking a form that counts well as an Elliott [b]-wave triangle. In that scenario, the drop from the final leg of the triangle might already have begun with a test of resistance near 1357.60 and a fall back beneath previously tested resistance at 1339.20.
A downward wave [c] out of the triangle would consist of five waves and would probably be strongly impulsive. The Gann-related support lines drawn on the futures chart below show some of the areas where price might bounce or consolidate in corrective waves during a decline. In the near term, a break of 1268.40 should bring price quickly to test a zone near 1233.00 to 1227.90. (It’s important to keep the bullish alternate scenario in mind when price reaches near that area.)
A break beneath 1227.90 which is one of the support areas shown in the alternate scenario, could serve as a signal for bears to catch another wave downward. A similar opportunity exists with a break of the lower boundary of the triangle. And of course both areas represent places where successful bears should lock in profits.
Lower targets in the main scenario at 1163.80, 1129.90, and 1096.60 are viable if the decline continues to act as an impulse. Ideally, wave [c] would reach at least slightly beneath the low of late 2015, but that is not guaranteed.
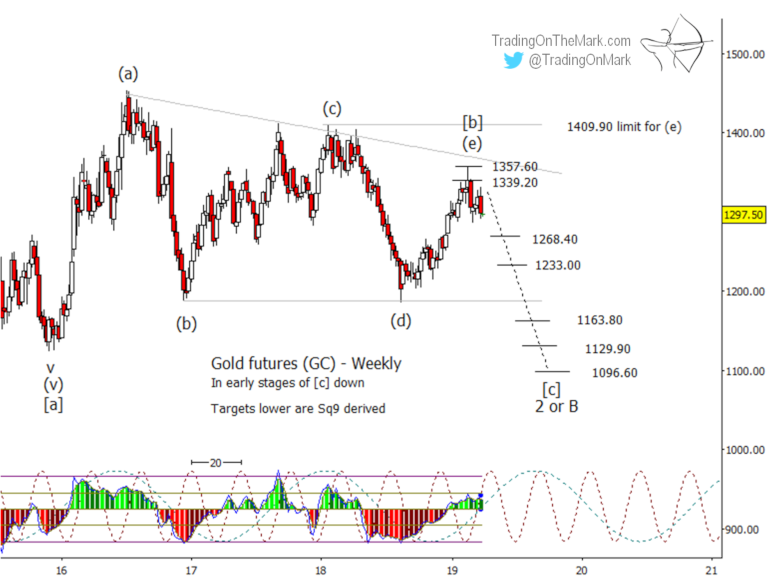
If any price rise takes place before a satisfying test of the first support area, then bears should be cautious. The absolute limit of a rise that still allows a triangle pattern is 1409.90. However for practical purposes, a break above the recent high of 1357.60 would represent a setback for near-term bears.
Alternate scenario – a different triangle with near-term bullish implications
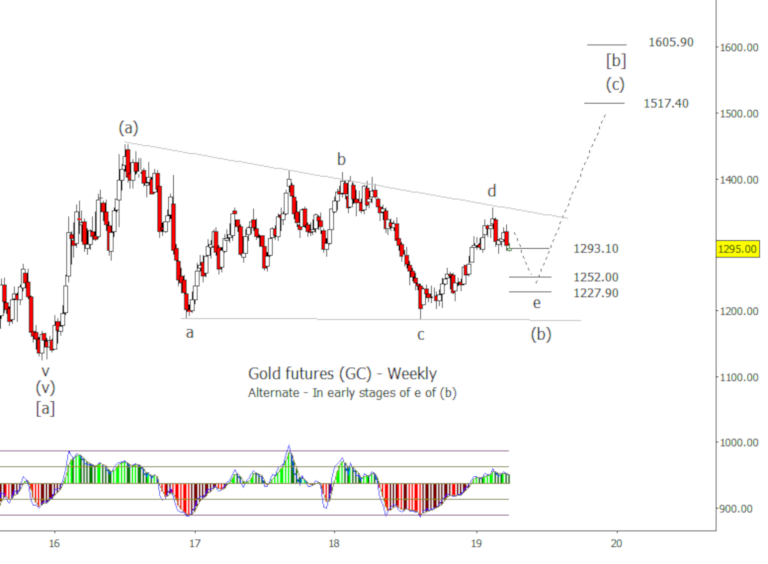
The chart below shows a different placement of a triangle inside the larger correction from 2015. In this view, the (b) wave inside the [b] wave is the triangle. That would produce an upward breakout instead of a downward one.
In order to decide whether the alternate scenario is working, traders should watch the standard Fibonacci retracement measurements of the move we have labeled as ‘d’ on the chart below. The supports include 1293.10, 1252.00, and 1227.90. If price shows stronger reaction to those levels instead of the supports shown for the main scenario, then bearish traders should be cautious. There may even be an opportunity for bullish traders with a test of one of the supports.
Traders should also watch any decline from the recent high to determine whether it appears impulsive or corrective. An obviously corrective move during the next several weeks would lend favor to the alternate scenario.
We note that both scenarios call for an eventual test of areas near or beneath the 2015 low. Longer-term gold bulls can take heart in the prospect that any new low in the next year or so should be very durable. It would provide the foundation for a strong rise that should continue for several years.
Equivalent forecasts for the gold ETF
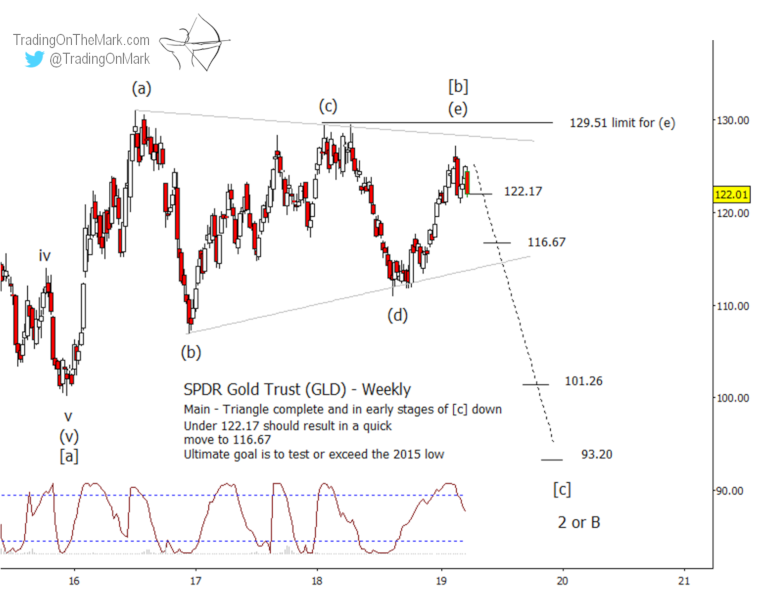
At the Trading On The Mark website we recently charted and wrote about our favored main scenario for the SPDR Gold Trust (symbol GLD). The Elliott wave pattern is the same as shown on the first futures chart in this email, but the calculated support levels show up with slightly different placement in relation to the triangle’s range. In particular, a break beneath 122.17 in GLD should lead to a quick test of the next support at 116.67.
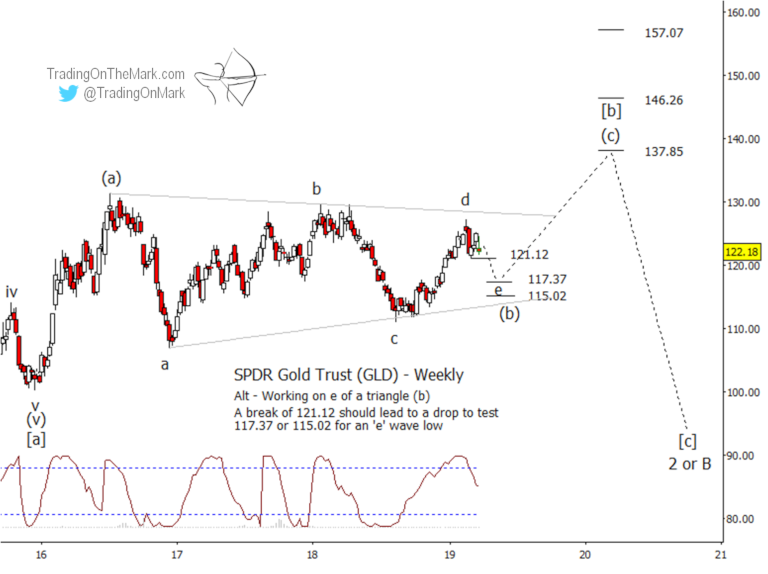
For the more bullish alternate scenario, the potential retracement levels to watch include 121.12, 117.37 and 115.02. As with the futures chart, potentially bullish traders should watch for a reaction to those levels in conjunction with a downward/sideways pattern that appears corrective.
You’re trading with an advantage when you have up-to-date charts. A Daily Analysis subscription at TOTM gives you constant access to up-to-date with charts on weekly and daily time frames for the Euro, the Dollar Index, gold, crude oil, bonds and the S&P 500.
If you’re wondering about the faster-paced market analysis that happens in the Intraday Service chat, this is an opportunity to check it out. Any current or new subscribers to our Daily Analysis can request access to the Intraday Service chat for two weeks. If you decide you like it, you can upgrade your subscription plan at the end of the trial period. Otherwise your subscription plan will remain the same.
Of course everything starts with the Daily Analysis service, which is available here.
Good fortune to you in your trading!
— Tom and Kurt at Trading On The Mark