As you know, readers of our free newsletter get exclusive charts and content. This edition recaps two trades in international stock ETFs that we wrote about in January and that worked really well. And of course we offer a forecast about what comes next with those funds!
Italian stocks can rally higher after a pause
The chart we posted in mid-January made a strong case to expect a wave (ii) bounce after last year’s strong decline in the iShares MSCI Italy ETF (symbol EWI). At that time we weren’t certain the rally could travel very far, but new signs indicate it should be able to reach higher levels sometime later this year.
You’ll note the rally commenced from where we had finished the wave (i) count, not long before our January post. The steady rise since then doesn’t yet have a corrective form, which suggests it is probably just the first part of a larger rally. On the weekly chart below, we have drawn a path that follows the conventional pattern for a second wave.
Readers who took advantage of the long trade might wish to take some profits as EWI reaches the first major resistance near 28.83. There might even be an opportunity for some relatively brief short trades based on that level and with a provisional downward target of approximately 30.00.
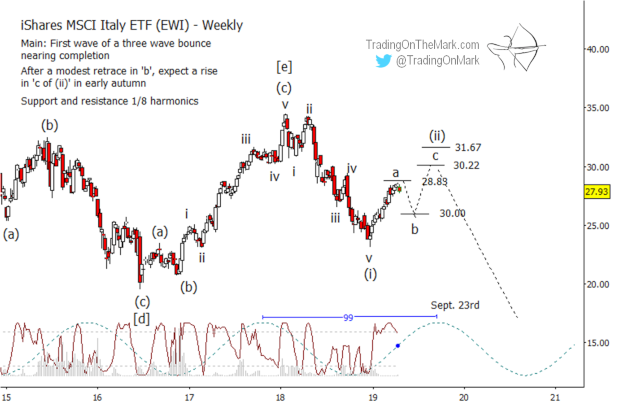
As we said, the bounce doesn’t look corrective yet. Eventual targets for later wave ‘c’ of (ii) sit above at 30.22 and 31.67.
The dominant 99-month cycle in EWI crests during the week of September 23, and that timing would fit nicely with the completion of wave (ii). However we note that the price swings in recent years haven’t lined up precisely with the cycle’s inflections.
Brazilian stocks might have finished their rally earlier than the Italian stocks
The resistance area we mentioned in January for the Brazilian stocks ETF appears to have held. Now it’s time to watch for signs that a downward impulse is forming.
Our January post about the iShares MSCI Brazil Index ETF (symbol EWZ) examined the upward correction that had begun in September 2018. At that time, we noted that the bounce had formed very near the support we had identified seven months earlier, in June.
We noted that the move from June to January appeared to be nearing completion, and that it had already produced a share increase of more than 40%. We anticipated a reversal, and the recent decline from resistance at 45.39 is a good sign the reversal might have occurred.
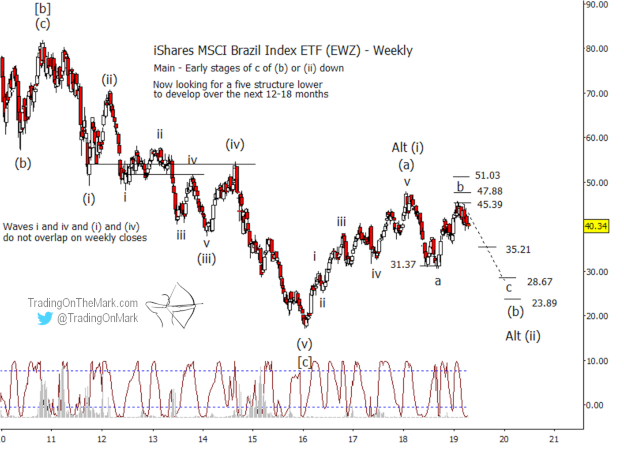
A downward impulse from here would probably not reach beneath the early-2016 low, although even that is possible. The most important Fibonacci-related supports on the way down exist at 35.21, 28.67, and 23.89. Of those, we expect at least the first support to be overcome, perhaps after some consolidation.
In our January post, we also noted that the Lomb periodogram (visible at the bottom of the chart) suggested that price was near the peak of the cycle that was apparent on a weekly chart. The recent decline in EWZ coincided fairly well with the cycle peak. The Lomb periodogram is a type of spectral analysis that has some advantages over the more common Fourier analysis.
You’re trading with an advantage when you have up-to-date charts. A Daily Analysis subscription at TOTM gives you constant access to up-to-date with charts on weekly and daily time frames for the Euro, the Dollar Index, gold, crude oil, bonds and the S&P 500.
Of course everything starts with the Daily Analysis service, which is available here.
Good fortune to you in your trading!
— Tom and Kurt at Trading On The Mark