As a reader of our free newsletter you get access to exclusive charts and content. This edition shows why now is a risky time to become too bearish with regard to the stock indices, using charts for the Dow and the NYSE Composite.
We’re also tracking the S&P 500 actively on a daily and intraday basis for subscribers at the main website, along with daily coverage of bonds, gold, the Euro, the Dollar, and crude oil.
The scenario we described in our April newsletter is playing out correctly
In the April newsletter we sent you on the topic of the NYSE Composite Index (symbol NYA), we made kind of a big deal about the opportunity to taking profits or make a trade based on resistance at 13123. At that time, the index was pushing right up against the level.
As you can see in the updated chart, below, our resistance level performed beautifully, and price has moved down into a natural retracement area with specific ratio-based supports and channel support nearby. The measured support area for the current retrace sits at 12203 to 12131, but as of today it appears the index is recovering from slightly higher than that area. Potentially bullish traders shouldn’t rule out the possibility of another test lower, but it is not guaranteed to happen.
As you have surmised, the NYA chart doesn’t look immediately bearish to us. Many traders in the market will see the NYA formation as representing successively lower highs, perhaps forecasting a more serious market failure. However the moves from early 2018 count best as being corrective, making the late-2018 price low a candidate for a wave (iv) low preceding a climb to a new wave (v) high.
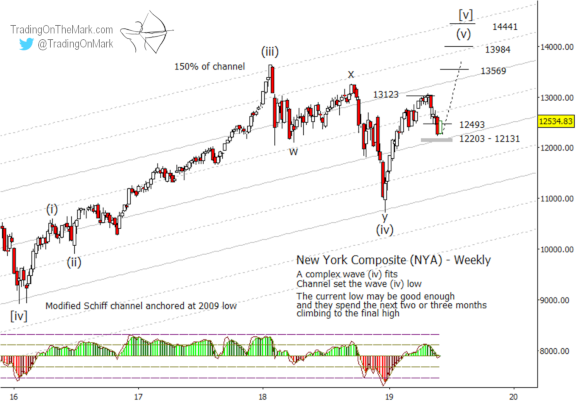
The more recent decline that followed our previous newsletter appears to be a smaller wave ‘iv’ inside the upward wave (v). Later in this newsletter we show how that count works for the Dow on a daily time frame, and NYA is behaving in approximately the same way.
Meanwhile the likely Fibonacci-based upward targets for wave (v) and a real top in NYA include 13569, 13984, and 14441.
Elliott wave practitioners also know there is a chance of a truncated move at major highs and lows. It’s not advisable to count on truncation ahead of time, but it sometimes appears obvious in hindsight. If there is going to be truncation in NYA, then the 0.618 Fib extension at 13569 is a good candidate area for it to happen. Just be aware there’s potential for a small (or possibly large) downward trade with tight stops near that area, depending on how the wave count looks on smaller time frames when the area is tested. We’d still want to see a nicely structured five-wave move up from recent support, even if truncation happens.
The Dow isn’t bearish yet either
We believe a market top isn’t far away, but the indices probably need to do more upward work first. Note how we don’t yet see negative divergence with the Adaptive CCI momentum indicator on the Dow chart below. In fact, the current area is a good candidate for a modest bounce from nearby support, just as with the NYA chart shown earlier.
Two different Fibonacci measurement techniques combine to produce a Dow support zone in the area of 24800 to 24490. The higher of those levels was tested this week, and the test might be good enough to serve as a platform for a bounce that could persist through the summer.
As with the NYA chart, note how price action from early 2018 looked corrective into the late 2018 low. In fact it looks even better as a correction on the Dow chart, with a nearly perfect Fibonacci ratio between sub-waves ‘w’ and ‘y’ of (iv).
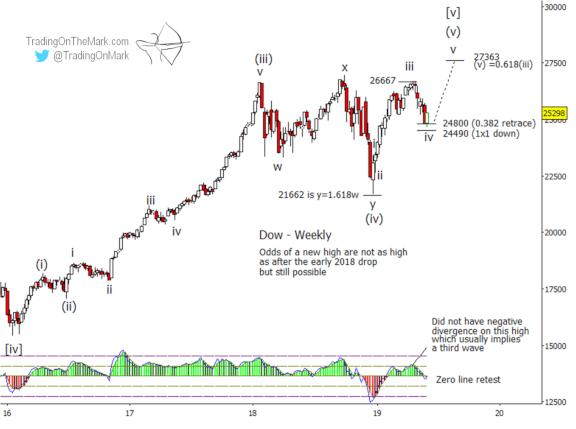
Important resistance that might be tested later this year sits at the 0.618 Fibonacci price extension at 27363. That would allow for a nice higher high (i.e., without truncation) in the Dow.
Watching for confirmation on a daily chart
A simple daily chart for the Dow shows several more reasons not to be bearish just yet.
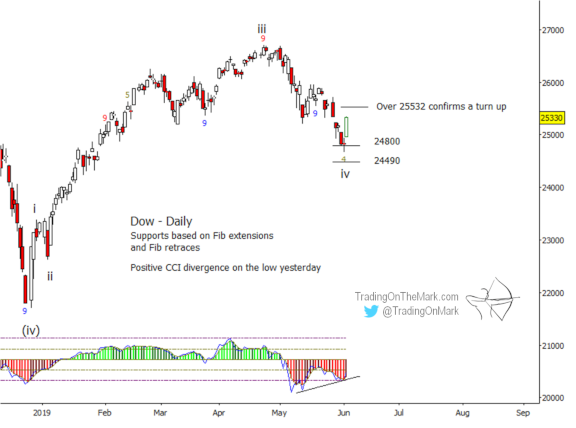
- Note how strongly price bounced from near the Fibonacci 38.2% retracement level near 24800. That’s a good retracement level for a wave ‘iv’, although we can’t rule out a test of the slightly lower support at 24490.
- Note how the CCI momentum indicator showed a strong positive divergence on Monday’s low.
- Note how the Wave59 proprietary “nine-five” indicator printed an exhaustion signal on Monday’s low. (The gold-colored ‘4’ is the signal, and it relies on micro counts of new lows during the downward move from April.)
If the Dow can rise above 25532, it would serve as pretty good confirmation that the market intends to take the index higher.
Good fortune to you in your trading!
— Tom and Kurt at Trading On The Mark