A few days ago we showed a bullish Elliott wave scenario for the Dow – one that we have been tracking closely for several months and that is working extremely well.
Today’s post offers a corresponding update for the whole NYSE Composite Index (INDEXNYSEGIS: NYA). There are reasons to expect the index to make a higher high later this year, but there’s also an important price area to watch for possible failure of that scenario.
First note, the forecast we described on April 16 for NYA is playing out correctly. In the April post we made kind of a big deal about the opportunity to taking profits or make a trade based on resistance at 13123. At that time the index was pushing right up against the level.
As you can see in the updated chart, below, our resistance level at 13123 performed beautifully, and now price has moved down into a natural retracement area with specific ratio-based supports and channel support nearby. The measured support area for the current retrace sits at 12203 to 12131, but as of this weekend it appears the index is recovering from slightly higher than that area. Potentially bullish traders shouldn’t rule out the possibility of another test lower, but it is not guaranteed to happen.
Although the NYA chart doesn’t look immediately bearish to us, many traders in the market will see the NYA formation during 2018 and 2019 as representing successively lower highs, perhaps forecasting a more serious market failure. However we believe the moves from early 2018 count best as being corrective, making the late-2018 price low a candidate for a wave (iv) low preceding a climb to a new wave (v) high.
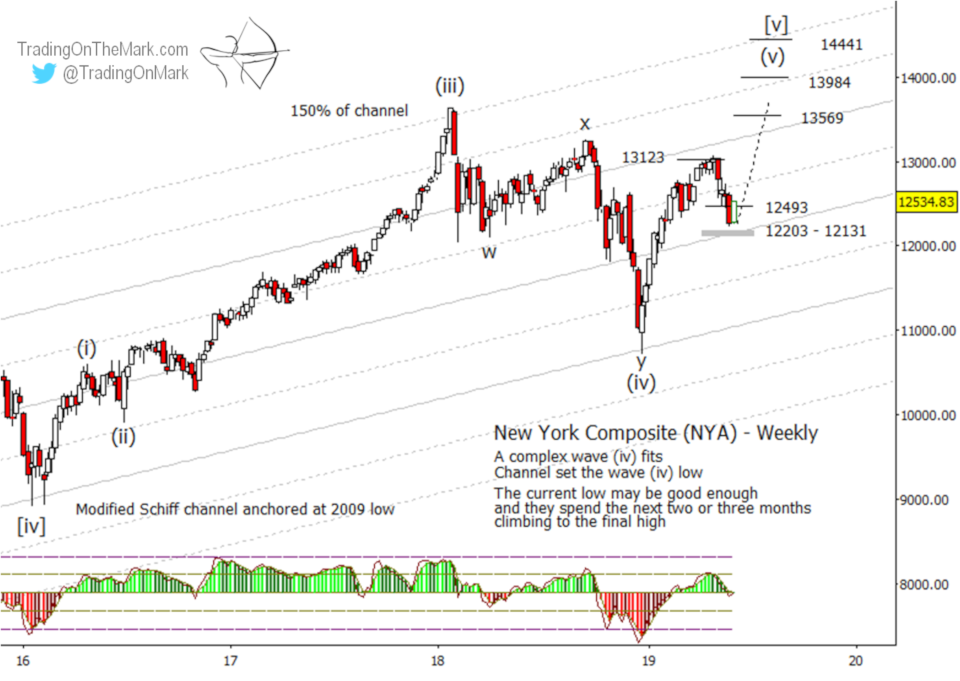
The more recent decline that followed our April 10 post appears to be a smaller wave ‘iv’ inside the upward wave (v). Later in this newsletter we show how that count works for the Dow on a daily time frame, and NYA is behaving in approximately the same way.
Meanwhile the likely Fibonacci-based upward targets for wave (v) and a real top in NYA include 13569, 13984, and 14441.
Elliott wave practitioners also know there is a chance of a truncated move at major highs and lows. It’s not advisable to count on truncation ahead of time, but it sometimes appears obvious in hindsight. If there is going to be truncation in NYA, then the 0.618 Fib extension at 13569 is a good candidate area for it to happen. Note, we’d still want to see a nicely structured five-wave move up from recent support, even if truncation happens.
This summer we’re offering really great chart subscriptions at deep savings to traders who get our free newsletter. Let us know if you’d like us to send you a copy.
In addition to the charts we share publicly, Trading On The Mark provides daily forecast updates for the S&P 500, treasuries, gold, the Euro, the Dollar, and crude oil. We also track the S&P 500 and other markets on an intraday basis.