With the FOMC meeting last week, the price of long-term treasuries is reaching our target area at an interesting time. The steep rise in recent weeks has been impressive, but it can also be misleading.
Looking at the iShares 20+ year Treasury Bond ETF (NYSEARCA: TLT), the rapid advance looks to us like the type of “blow off” move that precedes a reversal. Note that price has followed the upward path we showed to readers in early May, behaving as we would expect for wave (c) in a three-wave pattern.
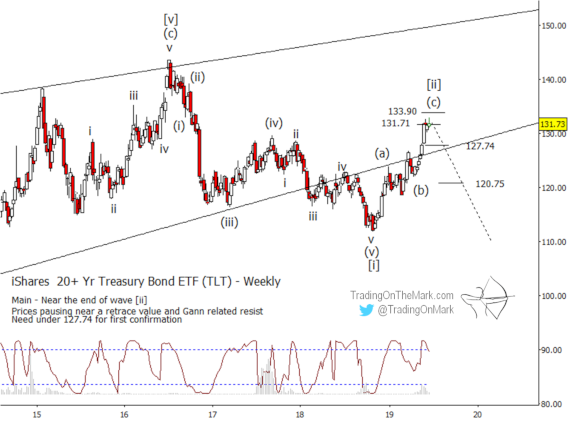
Our main scenario is shown below with price currently reaching the end of wave (c) of [ii]. We expect this to be part of a much larger [i]-[ii]-[iii]-[iv]-[v] impulsive structure that should eventually lead much lower. This view is supported by the fact that the charted price acted as though it was reaching a major top in 2016, consistent with the Elliott wave count we had been following for several years.
Specifically we note that price recently broke above the resistance zone near 127.74 and near the lower trend line shown. Now we are watching to see if that zone can act as support. If it fails we would expect a downward cascade.
Readers of our free newsletter get access to exclusive charts, analysis and special offers. Request yours here!

Poster promoting the first issue of U.S. war bonds, c. 1918
Last week price began testing the higher resistance level at 131.71. If price breaks through, then we will watch it in the same way we described previously for the lower zone.
Beyond that, important resistance awaits at 133.90.
The Lomb periodogram is also shown on the chart, and it indicates that the current rally may be reaching exhaustion.
A break of support at 127.74 and the nearby supportive trend line would serve as stronger confirmation that a downward reversal is taking place in TLT. Failure in that area should produce a relatively rapid journey to the next support at 120.75.
You’re trading with an advantage when you have up-to-date charts. A Daily Analysis subscription at TOTM gives you constant access to up-to-date with charts on weekly and daily time frames for the Euro, the Dollar Index, gold, crude oil, bonds and the S&P 500. Intraday Analysis offers additional moment-by-moment coverage of the S&P 500, ES futures, and related markets along with more detailed charts for the other instruments.