This week we wanted to alert our newsletter readers to the next moves we expect in currencies. Our analysis of the Dollar Index shows it to be testing a support region that we believe will serve as a platform for a strong move higher.
Here we show how the upward path might look for DX with a main scenario as well as an alternate one. Both scenarios are near-term bullish.
We also show how the Elliott wave count for DX translates to the most popular Dollar ETF. Meanwhile, you can find additional updates for the Euro in the subscribers’ area at our website.
The two most prominent scenarios for the Dollar are both bullish in the near-term, and the key support and resistance areas to watch are the same in each case.
The main scenario, indicated with black labels on the chart, has the Dollar working upward in an impulsive wave [v]. Within that structure, we believe price is looking for the support it will need to embark on the middle wave (iii) of the (i)-(ii)-(iii)-(iv)-(v) impulse. As you know, the middle wave is usually strongest.
Before upward wave (iii) can begin, we first have to see a conclusion to the sideways-upward consolidation that has been wave (ii). Some likely supports that could put an end to wave (ii) include 95.70, 95.00 and 94.07.
Note also that the 84-week cycle, shown in blue, is approaching an inflection that could correspond with a price low. It would be reasonable to expect the corresponding turn to take place sometime between now and approximately September. The Lomb periodogram, shown in red, corroborates the idea that price is reaching for a local low.
When an earnest rally gets underway, some bigger-picture resistance targets to watch for DX include 100.92 and then 104.53. We expect the first resistance to be overcome, although it might produce a period of consolidation.
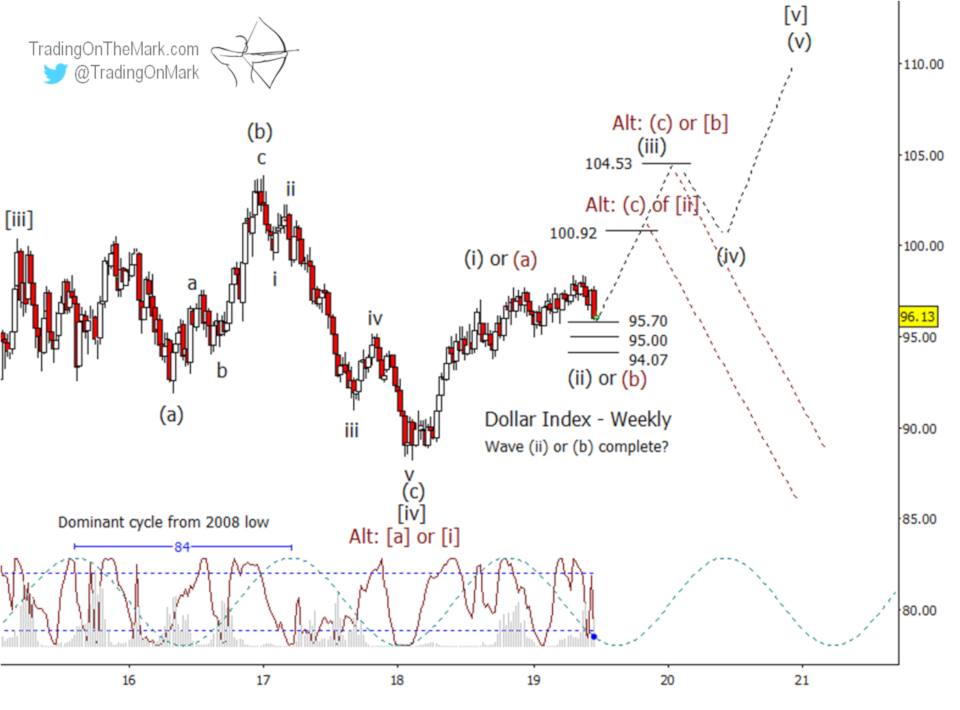
The alternate view, indicated with red labels, would treat the expected rally as an internal wave (c) of [b] or possibly wave (c) of [ii]. In that view, the Dollar will not be reaching for new highs during the next few years but will instead begin a persistent decline after it reaches a point of exhaustion in 2019 or 2020.
Even if the alternate scenario is driving the chart, the support areas and resistance targets shown on the chart are still relevant. An early warning that might favor shifting to the alternate scenario would be if we saw an extremely strong reaction to the lower resistance at 100.92. If DX is able to overcome that resistance, then the next area near 104.53 would represent a nice area to take profits from long positions and watch for further developments.
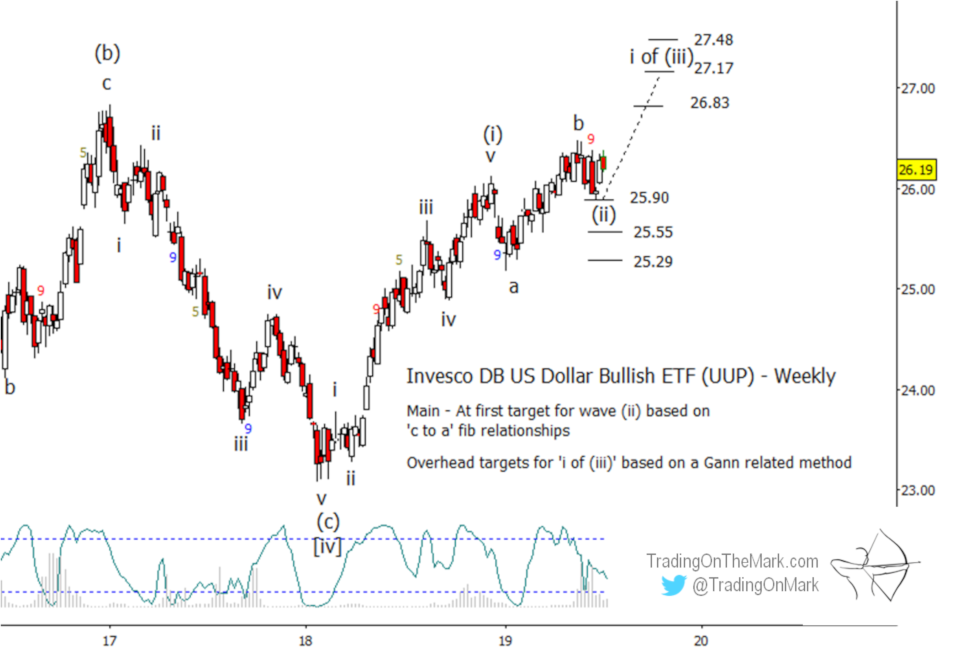
If you like to trade with ETFs, the Invesco DB US Dollar Bullish ETF (symbol UUP) follows the Dollar Index very closely. The support areas in UUP at 25.90, 25.55, and 25.29 correspond to the supports shown earlier for the index.
The resistance targets in UUP at 26.83, 27.17 and 27.48 represent initial targets for upward sub-wave ‘i’ of (iii). Eventually we expect UUP to climb higher than that.
You’re trading with an advantage when you have up-to-date charts. A Daily Analysis subscription at TOTM gives you constant access to up-to-date with charts on weekly and daily time frames for the Euro, the Dollar Index, gold, crude oil, bonds and the S&P 500. Intraday Analysis offers additional moment-by-moment coverage of the S&P 500, ES futures, and related markets along with more detailed charts for the other instruments.
Good fortune to you in your trading!
— Tom and Kurt at Trading On The Mark