Our previous newsletter described a very bullish case for the Dollar Index. Today, exclusively for newsletter readers, we’re looking at how the upcoming currency moves might play out for the Japanese Yen and the related ETF.
In mid-March, we showed Yen futures approaching the end of a potential Elliott wave bearish triangle that had spent the previous four years in a converging range. Even though our outlook was and still is bearish, we also cautioned traders to expect another bounce before price could break out of the triangle. The bounce took place mostly as expected although it started from a slightly higher level than the support we identified.
The structure of the spring bounce has led us to make a minor revision of our wave count for the Yen. It now appears to count best by treating the recent test of resistance as marking the end of the triangle. If that’s correct, we would expect to see a downward cascade during the next year.
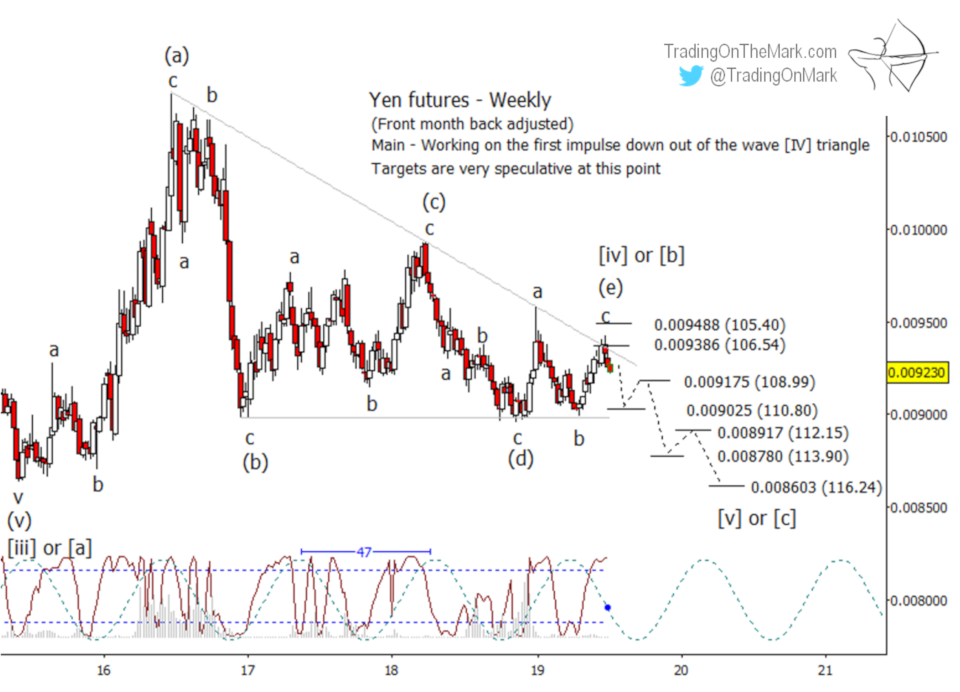
So far, price has rejected a test of resistance at 0.009886 (inverse 106.54), a level that is also near the upper boundary of the converging range. Additionally, the Lomb periodogram (red oscillator line) predicts that price is currently near a local high. Ideally we should see a fairly consistent press downward from the resistance area.
Even though we are now bearish even in the near-term, we can’t rule out a test of the next resistance level at 0.009488 (inverse 105.40). That development shouldn’t knock bears out of the market, but a weekly close above that level would make the near-term bearish case much less likely.
As we show on the futures chart, preliminary supports and targets include 0.009025 (inverse 110.80), 0.008780 (inverse 113.90), and 0.008603 (inverse 116.24). Each of those supports is a candidate to produce a small bounce.
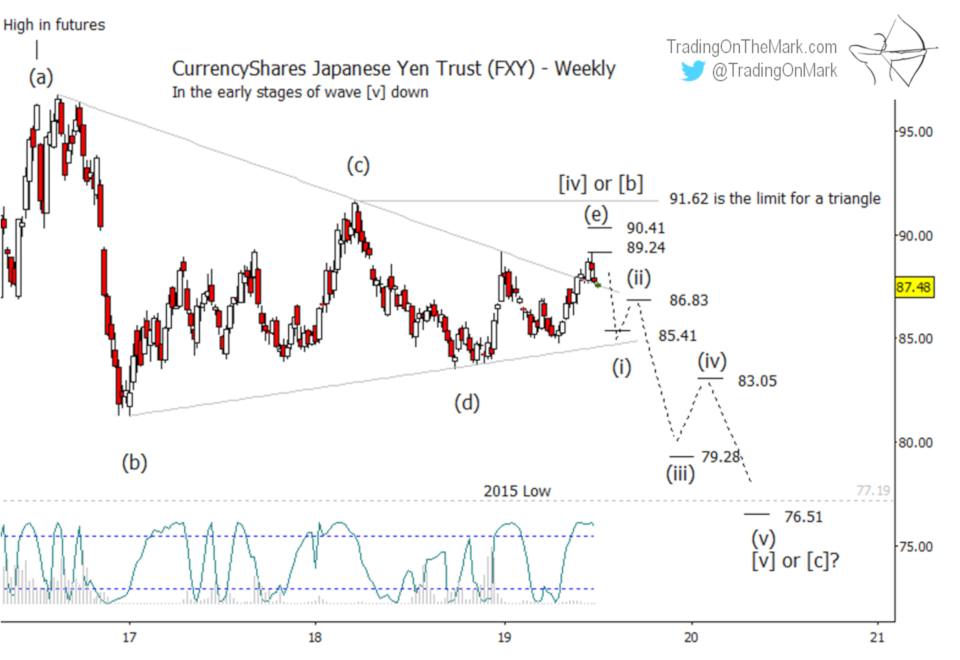
The next chart shows how the same scenario translates to the CurrencyShares Japanese Yen Trust (symbol FXY). The test of resistance at 89.24 appears to be working, but higher resistance at 90.41 still represents the point at which the bearish scenario becomes unlikely. The area of the previous high at 91.62 represents the absolute limit for price to rally while keeping this specific bearish count alive.
For ETF traders, good confirmation that our bearish count is working would come with a breach of support at 85.41. Below that there are additional preliminary targets at 79.28 and 76.51.
This summer gives you a great opportunity to lock in the deepest price cut we offer, and it’s available for either the Daily or Intraday service. A Daily Analysis subscription at TOTM gives you constant access to up-to-date with charts on weekly and daily time frames for the Euro, the Dollar Index, gold, crude oil, bonds and the S&P 500. Intraday Analysis offers additional moment-by-moment coverage of the S&P 500, ES futures, and related markets along with more detailed charts for the other instruments.
Good fortune to you in your trading!
— Tom and Kurt at Trading On The Mark