Here’s another alert for readers of our free newsletter, giving you the first look at charts showing some trading opportunities from an Elliott wave perspective. The British Pound has been in a strong and persistent decline since February, but that trend is overdue for a pause and maybe even a bounce.
The Pound is still following the basic plan we charted in January, working its way downward in what appears to be a fifth (terminal) wave of a five-wave decline from 2014.
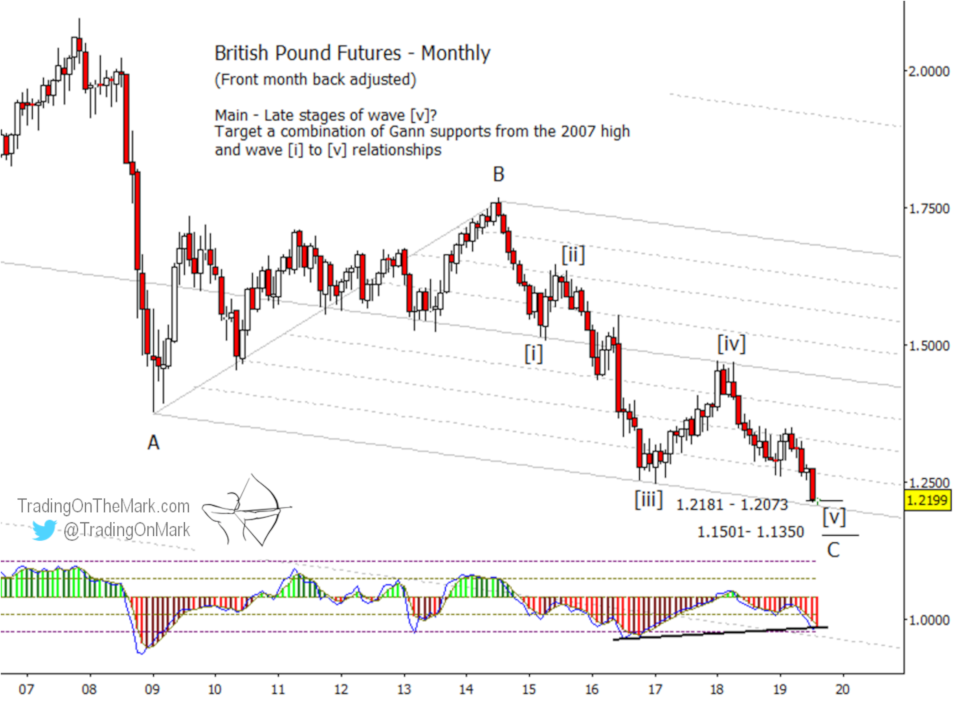
The monthly futures chart below offers some context for the decline. At present we believe the Pound is proceeding through downward wave [v]
of ‘C’. This is all part of a much larger bearish pattern that began in late 2007. Note how nicely the back-adjusted futures price has moved within the boundaries and harmonics of a downward-sloping channel. Also note the divergence that is developing between price and the momentum indicator.

The channel may continue to be important, particularly because one of our calculated Gann supports also sits near the channel boundary in the vicinity of 1.2181 to 1.2073. That is reason enough to watch for a tradable bounce.
If the first support on the monthly futures chart eventually fails, the next support area could be tested near 1.1501 to 1.1350.
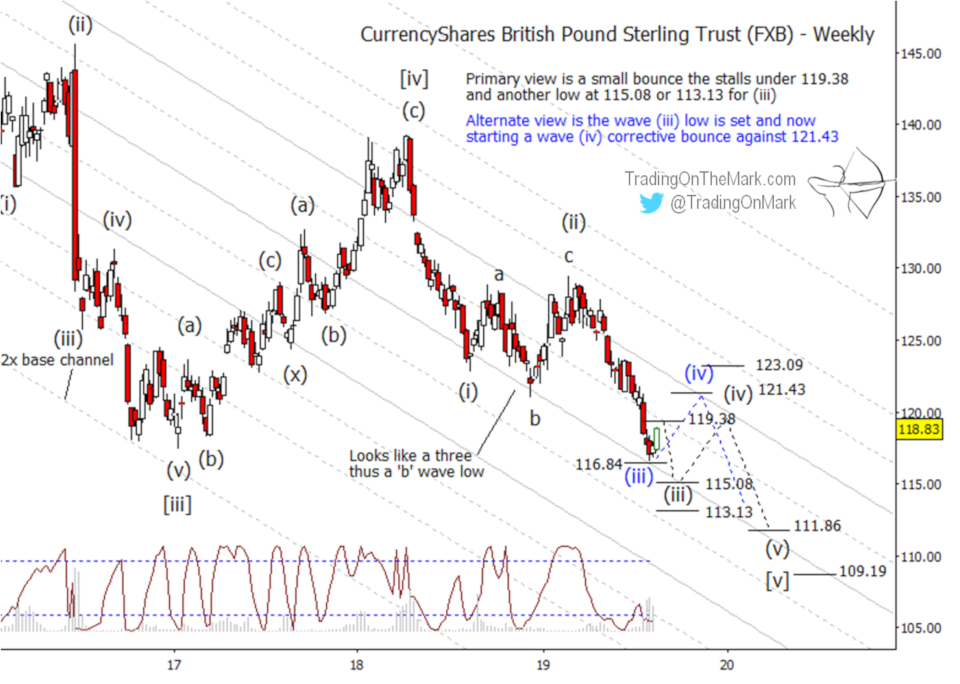
To see more detail in the progression down from the peak of wave [iv], we turn to a weekly chart of the CurrencyShares British Pound Sterling Trust (symbol FXB). The downward count of sub-waves (i) and (ii) is essentially the same as what we posted in January, although the final stages of wave (ii) reached slightly higher than we expected.
The rapid decline since February is consistent with a third wave, and we have drawn two scenarios for the end of sub-wave (iii). Our main scenario is shown with gray labels, and it would have FXB reach a bit lower to test 115.08 or possibly 113.13. However it is also possible to count sub-wave (iii) as already complete with its test of nearby support at 116.84. That’s the alternate scenario shown with blue labels.

The correction that would count as sub-wave (iv) could appear as either an upward or sideways pattern, and the resistance at 119.38 or 121.43 would probably contain it on the upward side.
We would prefer not to see FXB reach above the low marked as sub-wave (i) at 122.88. If price exceeds that level, it would suggest that downward sub-wave (iii) has more work to do before we can count it as complete. We note there is some resistance at 123.09, which is above the “line in the sand” for sub-wave (iv) in the scenarios we have drawn.
Price should eventually reach lower than the supports we mentioned for sub-wave (iii), but that move might not begin until late 2019 or sometime in 2020. In the meantime, bearish traders should manage their existing positions, and some traders might look for relatively quick bullish opportunities.
Good fortune to you in your trading!
— Tom and Kurt at Trading On The Mark
