Now that a corrective low appears to have been set, we’re able to provide readers of See It Market with updated targets for the iShares MSCI Italy ETF (NYSEARCA: EWI) based on standard Fibonacci measurements. This plays to one of the strengths of Elliott wave methods – identifying the places where a reversal is most likely to occur.
Recall that our early August post showed how EWI was trying to resolve the middle part ‘b’ of an a-b-c corrective pattern and move onward to the final upward leg ‘c’ of the correction. We suggested that a break of support at 26.00 was needed in order to say the entire corrective pattern was finished. Although the support was tested, the breach was short-lived. The support seems to be working as a platform for the wave ‘c’ bounce.

Cover photo: Geisler range within the Dolomites, viewed from the South Tyrol region (northern Italy)
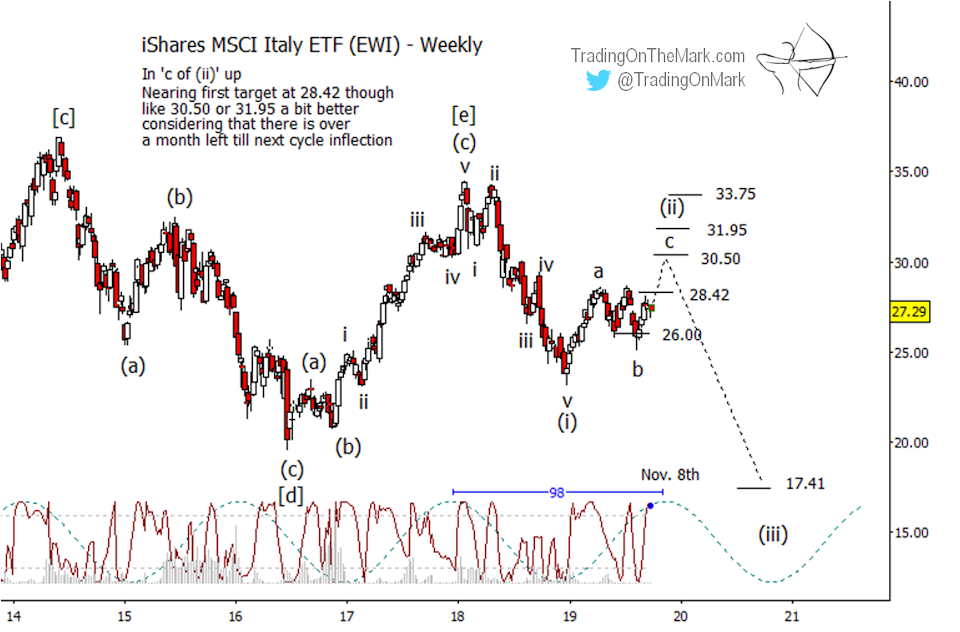
The next question is how high wave ‘c’ can reach. Knowing the magnitude of rising wave ‘a’ and now knowing how far down wave ‘b’ reached, the standard Fibonacci levels that might cap wave ‘c’ include 28.42 (currently nearby), 30.50 (the 1 x 1 measurement), 31.95 and 33.75.
The way price behaved near support at 26.00 illustrates one of the considerations that traders should keep in mind during the next several weeks. Although price moved beneath support for a brief time, it didn’t make a weekly close that was much beneath the level. The best that bears could manage at the time was a weekly close just a few cents below 26.00. No doubt some bullish traders exited prematurely or had their stops hit, but the more patient bull would have noted how support was never broken decisively.
Similarly, a potentially bearish trader might watch for signs that a break of resistance is “sincere” before giving up on a position that had a good entry price.
The updated chart also includes a slightly updated price cycle that should peak around the early part of November. Price cycles are rarely exact, but this one suggests that EWI should be allowed more time to test the nearby resistance and perhaps also the next resistance levels before traders play for a reversal.
As with our earlier post, a very preliminary downward target sits at 17.41 for wave (iii) out of the expected reversal.
A Daily Analysis subscription at TOTM gives you constant access to up-to-date with charts on weekly and daily time frames for the Euro, the Dollar Index, gold, crude oil, bonds and the S&P 500. Intraday Analysis offers additional moment-by-moment coverage.
Did you know that every month we select one recipient of our free newsletter to win a four-week access package to our premium subscription service? The newsletter brings you even more charts and in-depth analysis to help with your trading. Request your free newsletters here!