When we visited the Brazilian stocks ETF in early August, we pointed out that the highly adaptive Lomb periodogram was suggesting a downward reversal just as price was testing near important resistance. The resistance held so far, and we might now be seeing a small upward retrace that could be favorable for Brazilian bears.
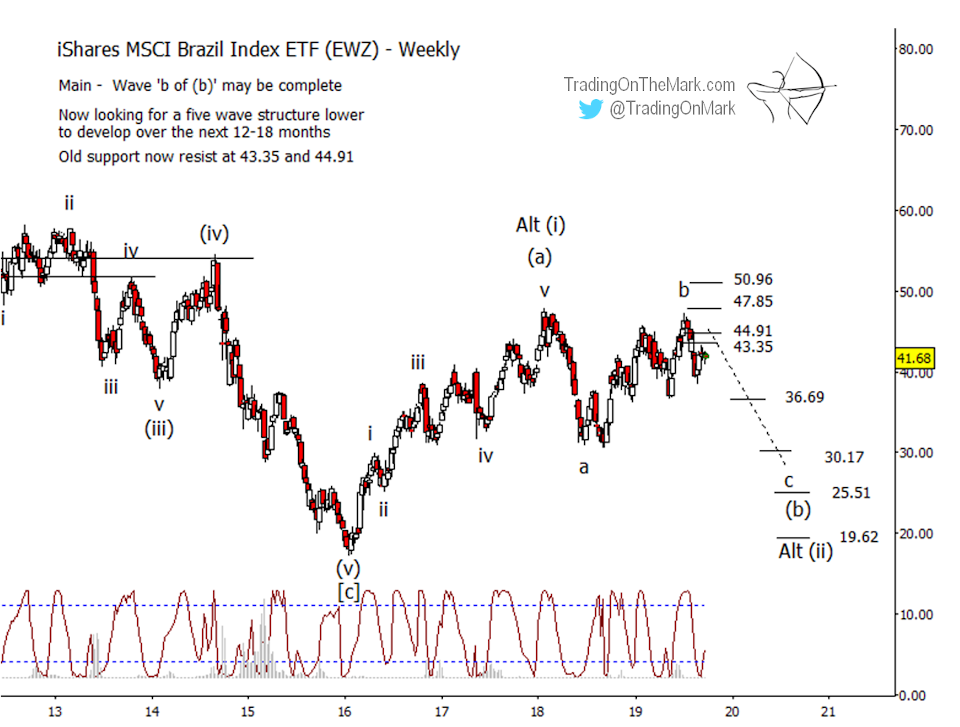
Here we show an updated chart for the iShares MSCI Brazil Index ETF (NYSEARCA: EWZ), with key resistance levels marked at the same prices we showed on August 1. We believe the Elliott wave pattern has been working through an upward corrective wave ‘b’ that might be complete. Resistance at 47.85 appears to have worked, although a fallback resistance level at 50.96 could come into play if price breaks higher again.
The levels at 43.35 and 44.91 should be viewed as broken supports, and the near-term bearish case looks healthy as long as that zone caps any upward retracement.

Cover photo: The Spectacled Bear (a.k.a. Andean short-faced bear) is the only surviving species of bear native to South America. The species is classified as vulnerable because of habitat loss.
The Lomb periodogram that we showed in the previous article coincided nicely with the provisional b-wave high, but we realize most readers don’t have access to that indicator. (It’s included as part of the Wave59 charting software that we use.) At the present time a 14-period fast stochastic indicator gives almost the same plot of the relatively fast cycles at work on a weekly chart of EWZ.
If the Lomb periodogram or the stochastic indicator move back to the upper zone in conjunction with a lower price high, that would represent a reasonably good entry signal. However the indicators are not guaranteed to swing back upward in that way, so traders should also pay attention to the way price behaves near the support-turned-resistance lines.
If the b-wave high is set, as we believe, then we should see an impulsive (five-wave) downward move to test the lower supports shown on the charts. The support at 36.69 might produce a pause in any decline, allowing bears to take profits or manage their positions. Next supports at 30.17, 25.51 and 19.62 represent more important areas to watch as ultimate targets of the downward impulse.
If this wave count continues to work as well as it has been working, then EWZ should try to plant a durable low sometime during the next one or two years, and that low should be higher than the low printed in early 2016.
Elliott wave is a great way to find the best trade entries and stop placements. A Daily Analysis subscription at TOTM gives you constant access to up-to-date with charts on weekly and daily time frames for the Euro, the Dollar Index, gold, crude oil, bonds and the S&P 500. Intraday Analysis offers additional moment-by-moment coverage.