The British Pound is signaling that the next phase of its decline may be more lengthy and “zig-zaggy” than originally expected. For the traders who follow our Elliott wave newsletter, that means there should be more opportunities for bearish and bullish trades during the next year.
In our emailed newsletter in late August, we showed how the Pound and the related ETF were due for an upward correction even though we expected the larger trend to be downward. The supports we provided in the newsletter worked very well to produce a sizable bounce, particularly with the ETF.
Now it may be wise to start marking profit targets for that upward trade and to watch for clues about where the next turn can take place. Recent price movement has caused us to set aside the downward impulsive count from the April 2018 high that we were using when we sent the previous email, even though that count produced a nice countertrend trade. The problem with the old count is that its upward wave (iv) of the impulse has strayed above the level of earlier wave (i), which violates Elliott wave rules.
The current charts offer new information from an Elliott wave perspective that has allowed us to identify two viable scenarios going forward, which we describe here for British Pound futures. You are among the first to see the new charts.
Main scenario: moving upward to complete a big fourth wave
The three-wave structure of the decline from April 2018 makes it a corrective wave. In larger context, that correction may be the middle wave (b) of a big wave [iv] of a larger impulsive decline from November 2007. In this scenario, the bounce that we predicted in the previous newsletter actually represents wave (c) of [iv], and it should reach to at least 1.3376 based on a standard 61.8% Fibonacci relationship with wave (a).
A higher target for wave (c) of [iv] may await at 1.4226, which represents a simple 1×1 relationship with wave (a) of [iv].
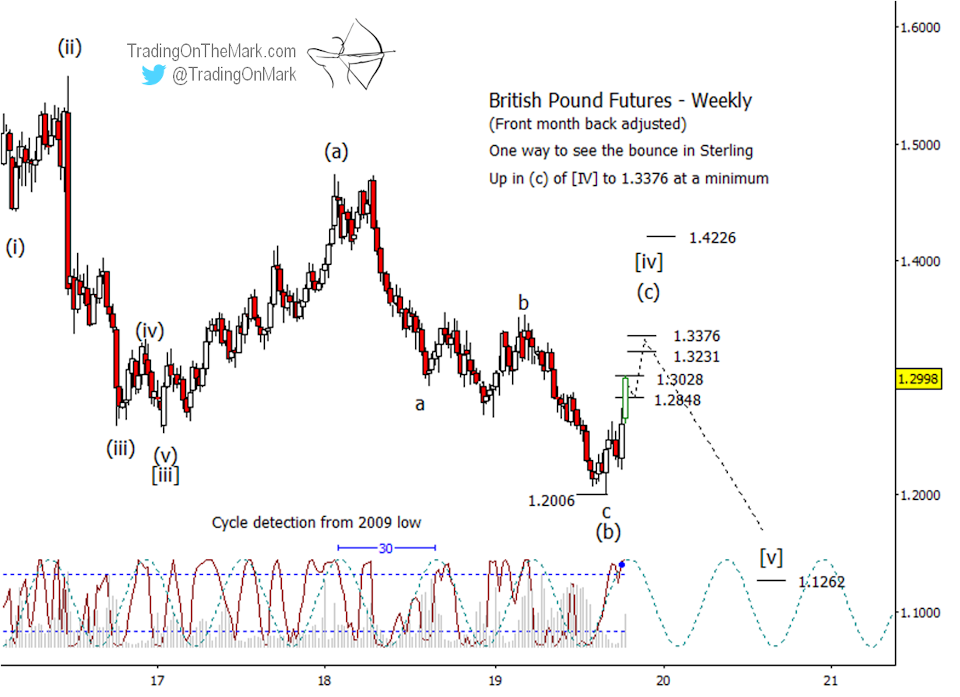
Although it may be too late to jump on board this bullish trade, readers should watch price closely during the next few weeks. If our main scenario is in control, then the upward move should show the strength that is typical of ‘C’ waves and third waves. Already we see indications of strength in the two most recent weekly bars shown.
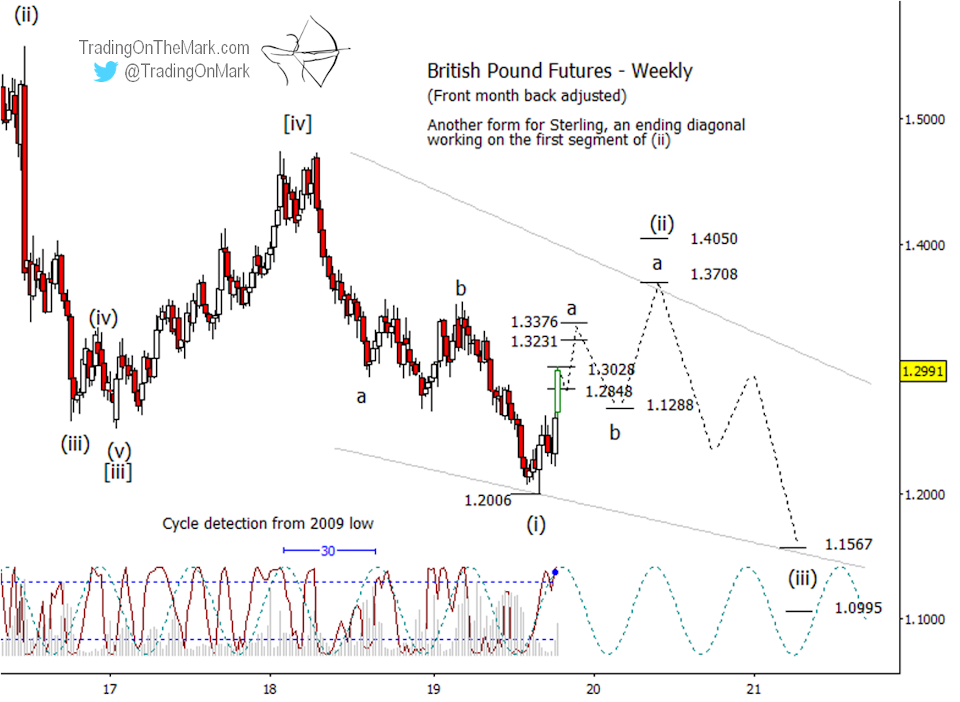
Alternate scenario: a lengthy ending-diagonal pattern
Our alternate scenario represents another way the pattern could accommodate the three-wave nature of the decline from April 2017. The decline could represent the first leg of an ending diagonal pattern, with the recent bounce being the start of the second leg.
In the near term, it may be difficult to ascertain that this scenario is working instead of the main scenario. Both the main and alternate can produce a decline near the resistance at 1.3376. The eventual difference would be that the decline wouldn’t go very far in the alternate scenario before bouncing again to reach a new local high, perhaps near 1.3708 or 1.4050.
In the present case, one way to approach a trade from these charts may be to use the primary scenario to identify levels for entries and stops. Then watch for signs that suggest price is deviating from the main scenario.
Watch the TOTM website for updated charts to be posted soon of the related ETF — the CurrencyShares British Pound Sterling Trust (symbol FXB).