This week we begin a series examining the rallies in some of the major U.S. stock indices. Depending on your time frame, there still should be some bullish trades available this year, but we think the bear may be lurking around the corner.
In the later months of 2018, when so many traders were expecting the market decline to accelerate, we were pretty adamant about treating the “crash” as just a fourth wave correction in the larger ascending Elliott wave pattern. See for example our January 2019 post about the Dow Jones Industrial Average (INDEXDJX: DJI) and the iShares Russell 2000 ETF (NYSEARCA: IWM).
So far, our expectations of a recovery and new highs in 2019 have worked extremely well, but the structure of this year’s rally is almost certain to fool many traders into becoming overly bullish going into 2020. There is still some up-side left, but bulls should proceed with caution.
As the first case study this week, we turn to the S&P 100 Index (INDEXCBOE: OEX). After its big plunge last autumn, the index climbed rapidly and has started interacting nicely with the harmonics of a modified Schiff channel.
Here’s where the 2019 pattern might be deceptive. Many wave traders will view the strong rally at the start of the year as an upward wave ‘i’ while seeing the back-and-forth action since April as a wave ‘ii’ correction. That’s view is probably incorrect, and it will cause many traders to be overconfident as they look for a more powerful upward wave ‘iii’ in the near future.
Instead, we believe the price action since April counts better as a contracting triangle, which means it probably represents wave ‘iv’ of the climb out of last year’s “big crash”. The rally from late 2018 can also be counted as waves ‘i’, ‘ii’ and ‘iii’ that should precede the triangle.
The implication is that the big rally is closer to being complete than most traders realize. Now OEX is merely working on finishing upward wave ‘v’ of larger wave (v). That should lead to a real downward reversal – a true bear market that will probably start sometime in 2020.
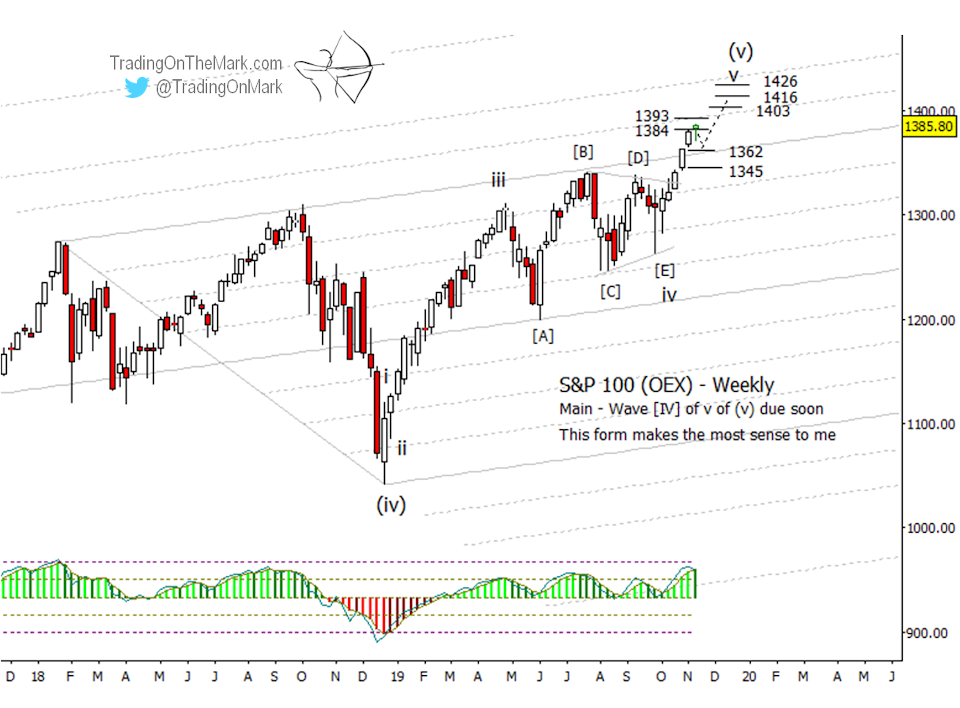
With that larger picture in mind, there still should be some opportunities for bulls this year, as long as they are careful with their entries and stops. As we mentioned earlier, OEX is just now testing one of the major channel lines, and there is additional resistance nearby at 1384 and 1393. Those factors normally would produce at least a modest pullback, and we have highlighted two support areas to watch at 1362 and 1345.
And end-of-year rally seems quite likely after a small retrace. Some preliminary OEX resistance targets include 1403, 1416 and 1426. Based on our cycles work in other markets, there are indications that those targets might be tested sometime in January.
As an alternate scenario, if the market really does have more up-side than we believe is the case, the June high we labeled as ‘iii’ could end up being just wave ‘i’ of a larger upward impulse. That would make the current rally part of an upward wave ‘iii’ which would probably be quite strong. The way to monitor for this contingency is to watch how rapidly the market climbs into January. If the rise feels “relentless”, then we would need to reassess the bearish view that is currently our main scenario.
It’s easier to find the trades when you start with the right charts. For a limited time this fall, get access to all the charts and lock in a 15% price reduction with the coupon code AUTUMN. Get coverage of the Euro, the Dollar Index, gold, crude oil, bonds and the S&P 500 on weekly, daily and intraday time frames.
Watch for our next post here at Investing.com, which will forecast developments in the Russell 2000 ETF.