As an exclusive update for our newsletter readers, we wanted to highlight some trading opportunities in currencies that should manifest during the first 1-2 months of 2020.
The Japanese Yen appears to be following the downward plan, although bearish traders might wait to take advantage of the next bounce as an entry signal.
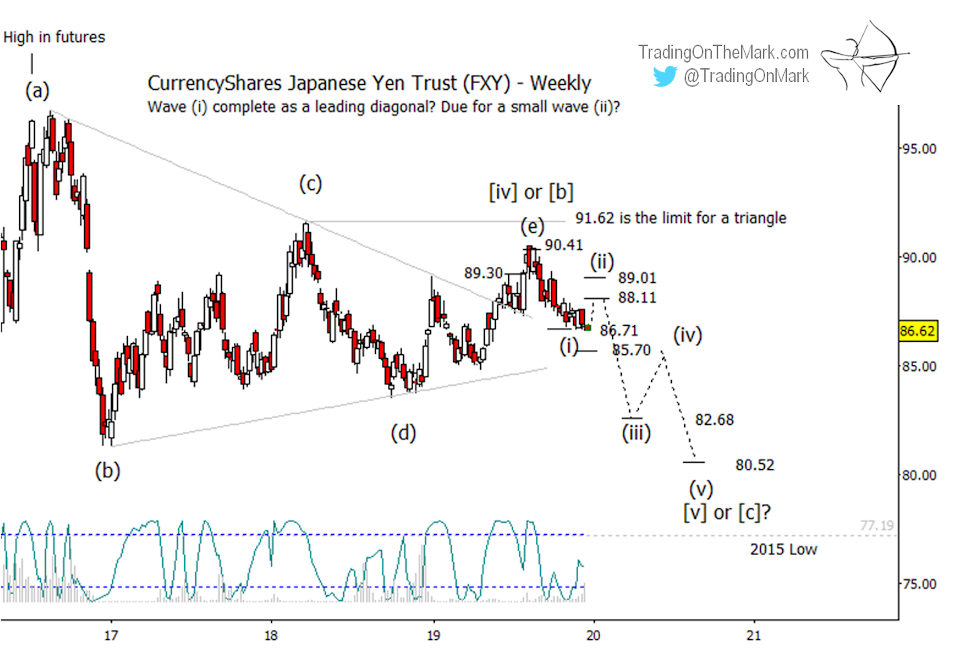
As you know, we’ve been monitoring the Yen’s progress through what we believe was a fourth-wave triangle. That consolidation appears to be finished, with the recent rally stopping at one of the levels we alerted you to earlier. Since then price has drifted down to the very important area near the triangle’s midline in what might be the start of a downward impulsive pattern.
Within that impulse, a wave (ii) bounce in the ETF doesn’t have to travel far in terms of price. Some resistance areas that could cap a retrace wait at 88.11 and 89.01. (There is some timing suggested by the futures chart, shown later in this email.)
Our July 2019 chart for the CurrencyShares Japanese Yen Trust showed the fund testing resistance at 89.24, and we also said it could test the next higher resistance at 90.41 before declining. That’s exactly what happened.
More conservative bears might watch for a decisive break of the ETF supports that sit at 86.71 or 85.70 – supports we derive from a Fibonacci-related technique.
Note that the Lomb periodogram is signaling that now is a likely time for an upward reversal of some type. That is consistent with the expectation of a small wave (ii) bounce.
The next lower support and resonance levels at 85.61, 82.68, and 80.52 are merely preliminary based on a Fibonacci-related technique. We will be able to identify more fine-tuned targets when it is apparent that upward wave (ii) has finished playing out.
As a newsletter exclusive, here’s how the corresponding levels appear on a chart of front-month (March) Yen futures.
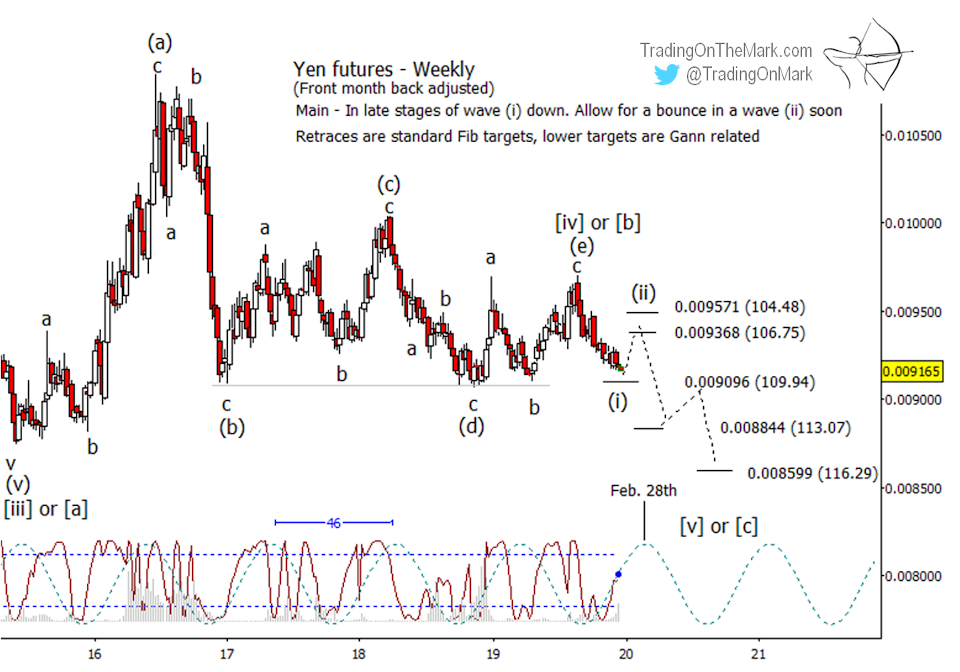
The next inflection in the 46-week price cycle falls on the week of February 28. That and/or a crest in the Lomb periodogram could coincide with the peak of a wave (ii) bounce into resistance at 0.009368 or 0.009571 (inverse 106.75 or 104.48).
The support that needs to break for confirmation of the downward scenario sits at 0.009096 (inverse 109.94), although that might not represent the ideal trade entry depending on your approach. Beneath that, there are approximate targets for steps in a downward impulse at 0.008844 and 0.008599 (inverse 113.07 and 116.29).
A similar reversal might have begun with the British Pound, which appears to be following our plan.
The email we sent you in October showed two scenarios for the Pound – a main and an alternate. So far, price action continues to favor the main scenario with the Pound having traveled upward to test resistance in a sizable wave (c) of [iv].
The recent U.K. vote produced a rather abrupt spike into resistance at 1.3604 – a level we highlighted for you in the previous email. Price then showed a strong bearish reaction to the level, which we interpret as a favorable sign that a downward impulsive wave [v] might be starting.
Tests of higher resistance at 1.3822 or 1.4102 are still possible in the main scenario, but they are starting to appear less probable. The very important support at 1.2981 is being tested this week, and a break of that level would serve as reasonably good confirmation that the downward pattern has begun.
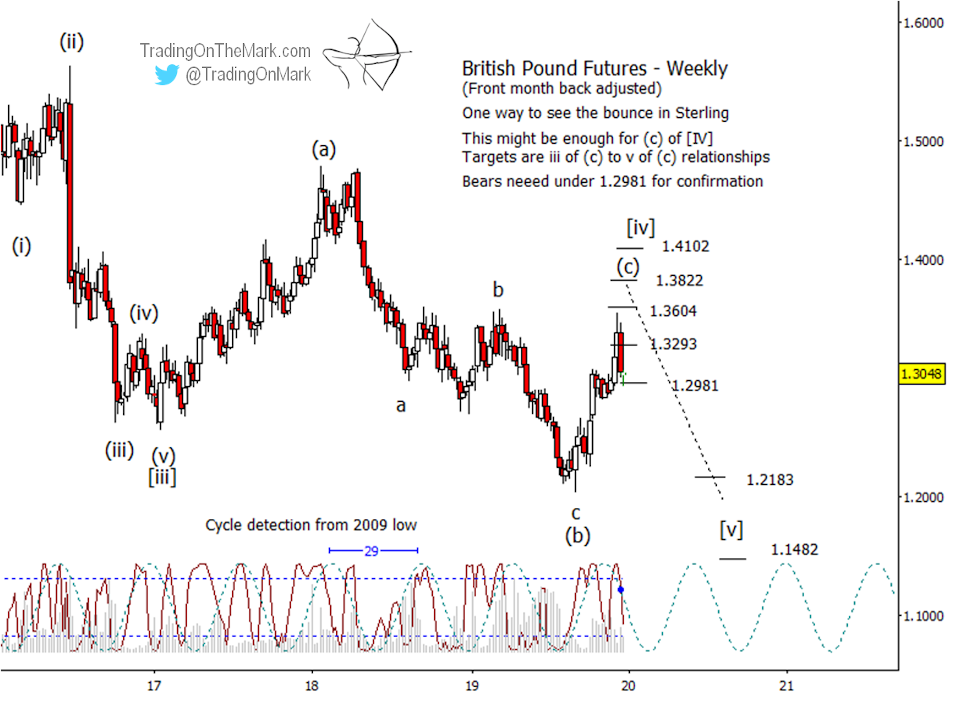
Note that two of our timing tools suggested the price spike would be short-lived. The 29-week price cycle has shifted into its downward phase, while the more rapidly responsive Lomb periodogram has peaked.
Some very preliminary targets for downward wave [v] coming out of the corrective pattern are 1.2183 and 1.1482. We’ll be able to refine those targets when there is more of a wave structure to measure against in the downward pattern.