For readers and the authors alike, our lives have been upended by the pandemic and the economic contraction. There are plenty of reasons to be skeptical about the health of the economy while protecting one’s own health, but it would be a mistake to translate that view directly to the markets we trade. Several of the major U.S. stock indices are showing technical indications that they can reach new highs this year.
In this piece we show a bullish Elliott wave case for Invesco QQQ (NASDAQ:QQQ), which closely follows the Nasdaq-100 Index. In our view the climb from the 2008 low is not quite finished, and the steep price rise during 2019 and the first two months of 2020 did not meet the criteria to be a terminal pattern. The top probably isn’t in yet.
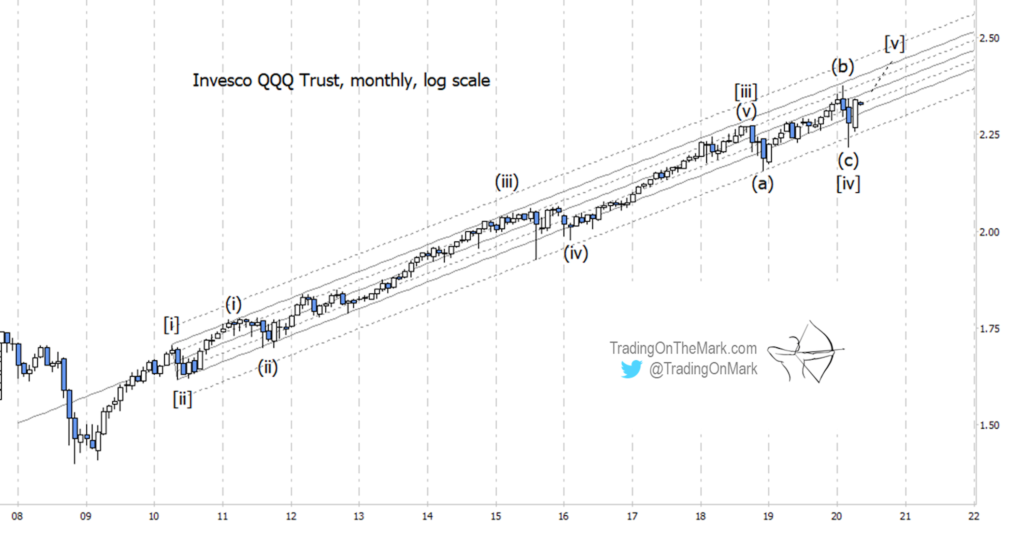
During the climb from 2008 into February of this year, the value of QQQ shares increased by a remarkable 848%. When charting assets that have traversed such a wide price range, it often helps to step back and apply a logarithmic scale to compensate for the phenomenon of near-exponential growth. The market’s really big players watch log charts.
Standard Elliott wave tools such as Fibonacci relationships don’t work very well on a logarithmic scale, but chart geometry often works quite well. Looking at the long rise of QQQ, we see a channel that remains unbroken. The lower 50% harmonic boundary has been tested during each of the “scary” lows during the past five years, but in each instance price was able to push back into the main part of the channel.
A test of a lower channel boundary in a bullish market often corresponds to an Elliott fourth wave of some degree, and that’s how we interpret the three tests seen on the log chart here. In the larger-degree count, the most recent corrective wave [iv] has tested the boundary twice. Within the earlier wave [iii], the sub-wave (iv) tested the same boundary.
The next chart shows how the same wave count applies to a regular (linear) chart. A resolution at the level of weekly candles also allows us to get useful information from the adaptive CCI momentum indicator.
The most important detail from the chart is that the rise from late 2018 into February appears corrective, which means it can’t be a terminal pattern. The entire fourth wave took an (a)-(b)-(c) form, with wave (c) finishing higher than wave (a).
Price now should be working its way through upward wave [v], which is expected to be a terminal pattern.
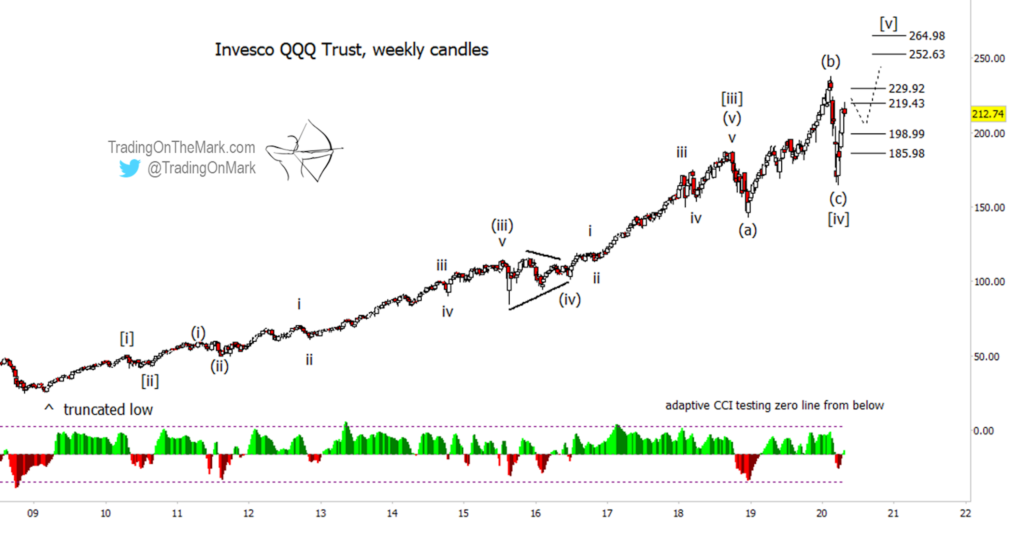
In the very near term, QQQ is meeting resistance at levels corresponding to Fibonacci multiples of a smaller sub-wave within the recent rise. Price could make a pullback soon, perhaps from near 219.43 or 229.92. Likely target areas for a small retrace include 198.99 and 185.98.
Note that the adaptive CCI momentum indicator is currently testing the zero line from below. It might need to retreat slightly, but an eventual breach of the line will probably correspond to some upward acceleration in price.
In the slightly bigger picture, typical Fibonacci-based resistance levels that could put an end to the rise await near 252.63 and 264.98.
We’ll have more to say soon about other U.S. indices as well as some of the commodities we regularly chart.