
Dollar conditions right for a bounce
Our bullish analysis is a little controversial

This could be the top in S&P 500
(The alternative is for it to extend considerably higher after a retrace.)

Gold mania
Don't get trapped

Can GLD just keep climbing?
We're cautiously watching for a pullback

The QQQ’s can press higher
Just ignore the shaky foundation
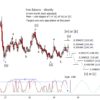
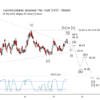
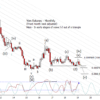
Japanese Yen Futures & ETF FXY Update
Yen appears to be accelerating lower after the minimal retrace made when I last updated this chart a few weeks ago. I'm assuming this is the early stages of (iii) of [v] or [c] down. Minor support being tested now at 0.008994 though I don't think it will be very firm. Prefer lower targets at 0.008789 or 0.008643 before a more substantial bounce.

Dollar fund poised to rise
There are already preliminary signs of a breakout

Fishing for a natural gas low
Chart updated with additional supports
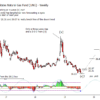
Natural Gas and UNG Update 2020-01-07
I'm going to use the weekly UNG chart for the big picture and then switch to the daily natural gas futures chart for the fine details.
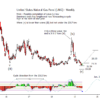
Japanese Yen via ETF FXY 2019-12-04
Yen has dropped steadily from the wave (e) of a triangle target of 90.41. So far, no complaints as it has been on plan. FXY has tested support at 86.71 with the Lomb pulled down where it is...

Russell 2000 ETF struggling to meet bulls’ expectations
It still might catch up

Brazil stocks following the bearish plan
The corrective high might be set

Newly refined targets for Italian stocks
along with cycles analysis

Yen responding well to resistance
The expected reversal may have begun
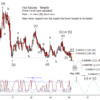
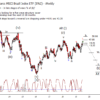
Japanese Yen Futures and ETF Update 2019-09-14
As you know, I have been critical of the rise in the Yen over the last month and continued to think it a developing wave [iv] or [b] triangle. Over the last three weeks that has been a strong reaction against resist at 0.009623. Certainly appears that prices are moving down in the early stages of [v] or [c] down out of the triangle. Supports on this chart are Gann based and while I think prices will react to them, it is very speculative at this point estimating where the turns will be in the five wave sequence. It is worth noting that the 'c of (e) of [iv] or [b]' terminated on a cycle inflection which implies a drop to the next in March of next year at a minimum and perhaps out to the following inflection next August.

Natural gas starting to simmer…
Opportunities nearby for bulls
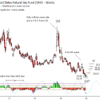
Natural Gas via UNG Update
I have been looking for a possible wave (v) low in UNG for the last couple months and it looks like we may have one that sticks. It has spent the last few weeks up from a test, and brief poke under, support at 18.10. Goal now is to establish a five wave move up for an initial impulse up. Resist at 21.81 and 22.89 on the weekly chart. I'm working on the premise that the dominant weekly cycle is inverting and thus for a net rise into the end of the year.

British Pound due for upward correction
It might already have begun

Potential for higher Yen may be limited
It's already retreating from calculated resistance
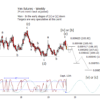
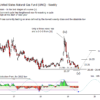
Yen Futures and ETF (FXY) Update – 2019-08-07
Yen has rallied up with gold but I still think the overall Elliott triangle is still valid. It looks like the dominant weekly cycle will be invert and be a high. The ideal cycle infection point is September 13 but we are already in the window. First step for a reversal would be falling under prior resist at 0.009386.

Brazil stocks to break downward
EWZ is in the resistance zone

Italian stocks expected to decline
The upward correction probably won't shoot much higher
Natural Gas via UNG Update
As you know, I've been watching UNG for a possible significant cycle low nearby and expecting a rise into early next year. While prices have slipped a little lower, that is consistent with the main forecast on the daily chart from the last update. UNG is now near weekly and daily supports and is worth monitoring closely.

Yen ETF preparing for a breakdown
out of an Elliott wave triangle
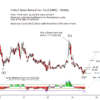
Natural Gas via ETF (UNG) Update
Making a UNG update since I spent time staring at the daily. First, the weekly chart. Nothing new from when I last posted it. I think UNG is trying to feel out for a low in the 62 week cycle. Price needs to be over 21.65 to cause bears to cover.
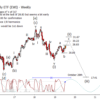
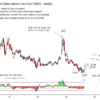
iShares MSCI Italy ETF (EWI) Update
At the start of 2018, EWI ended wave [e] of a triangle and dropped in the first five wave impulse lower at the end of last year. Since then, EWI has been bouncing in a three wave move for a wave (ii). While having tested a possible target at 28.83 two weeks ago, it strikes me as too aggressive to say that wave 'c of (ii)' is complete while above 30.00 as the overhead target tested so far is a bit short of what is typical for a wave (ii).
iShares MSCI Brazil Index ETF (EWZ) Update
Treating this overlapping bounce in EWZ up from the low last year as a 'b' wave and expect prices to turn down again in an impulse over the next few weeks.

Dollar Index coiling for a break higher
Traders should watch for a pullback or a breakout
Japanese Yen and ETF (FXY) 2019-07-09
One of the reasons that I have been skeptical about the gold rise is the correlation that it has had with the Japanese yen and I'm still bearish yen as the triangle is still valid here.

Expect a reversal in treasuries soon
Don't be fooled by the steep rise
Natural Gas via (UNG) – 2019-06-02
When I last wrote on UNG, I was looking for a possible truncated wave (v) low in conjunction with a projected cycle low for the year. Prices did in fact climb but was rejected by initial resist at 23.31. Despite that, the overall forecast for a possible low for the year in development is the same.

Dollar ETF building up steam
Leaving the current station soon
Natural Gas via UNG 2019-05-13
The weekly cycle in UNG has lengthened and is now forecasting a low over the next several weeks and rises toward the end of the year. The daily chart has a five wave count down from the wave iv bounce high in March. Prices rising over 23.31 is first confirmation that the low may be set though it is conceivable that the turn up is slow like in mid 2018.
How much longer can T-bonds keep rising?
Is your seat belt fastened?

Brazilian stocks unable to climb out of range
Is it time for the reversal?

Gold ETF ready for breakout move
Our main scenario is bearish, but there's an alternate too

Yen ready to break out of range
This spring might see a downward cascade
Natural Gas via UNG 2019-03-10
Back when I last updated UNG charts, I thought a bounce was due and in fact one has taken place. The question now is, was the low in February the end of the pattern down from the November high from last year or is there one more low left? I favor the latter because fourth waves typically have a complex wave form and we have yet to a new low or test of the 2017 low. For timing, thinking the best time for a low is late March or early April, even it turns out to be a higher low.
Yen Futures & Yen ETF FXY 2019-03-03
When I last posted charts on Japanese Yen, I was looking for a bounce up from a possible (d) wave low of a triangle [iv]. It looks like the last wave of that triangle, wave (e), completed at the start of this year. Cycles suggest wave [v] down is in progress and could last till August of this year

Natural gas preparing to lift
It might be making a durable low

Is the Euro getting ready to fold?
The latest bounce retrace was very weak

Brazilian stocks climbed 40% off our support
What comes next after that 3-wave move?

British Pound getting ready to resume its decline
Two resistance zones to watch

Big-picture forecast for the Dollar ETF
Ready for launch?

Italian stocks may need to climb a little
Time for bears to manage positions

The sun hasn’t set on stock indices quite yet
There's still a bullish count

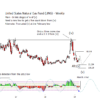
Crude oil decline is overextended
Watch for a countertrend swing

Crude oil fell, as ordered
The ETF dropped when it reached the right altitude

More decline ahead for copper mining fund
Bears need to wait for it to reset first

A warning to crude oil bulls
The last high was probably an overshoot