My premium content
Morning & evening updates
We chart the S&P 500, crude oil, the Euro, Dollar Index, treasury bonds, and gold, typically with a morning and evening post for every trading day.
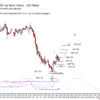
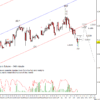
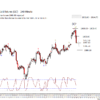
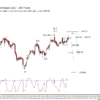
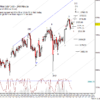
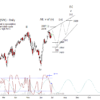
The Day Ahead: AM Edition 2021-01-14
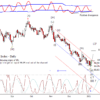
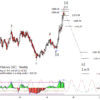
Bonds managed higher yesterday but a little soft to be entering a small wave III up just yet.
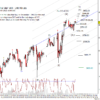
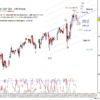
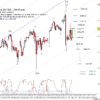
First Look: 2021-01-14
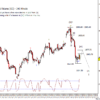
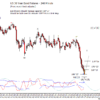
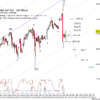
A resist target talked about in chat was tested late in the evening yesterday at 3817 in S&P 500 futures.
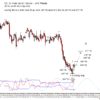
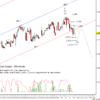
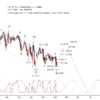
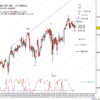
The Day Ahead: AM Edition 2021-01-13
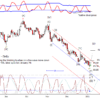
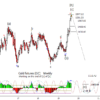
Bonds are breaking over 168^22 in what could be wave III of (I).
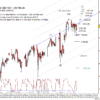
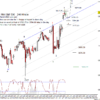
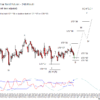
First Look: 2021-01-13
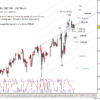
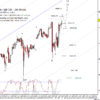
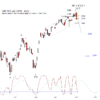
S&P 500 futures fell overnight to test the 3776.25 and have been rising since.
The Day Ahead: PM Edition 2021-01-12
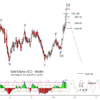
Bonds started the day moving lower to test 167^16 then had a nice intraday reversal up that took it up through the 168^05 to 167^29 support range and just underneath old support at 168^31.
The Day Ahead: AM Edition 2021-01-12
Bonds slipped under 168^00 and pushed for the next target down at 167^15.
First Look: 2021-01-12
Little change in S&P 500 futures overnight as they stayed in the sideways range from yesterday.
The Day Ahead: PM Edition 2021-01-11
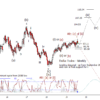
Bonds briefly tried to bounce today but couldn't overcome 168^31 but instead pushing lower away from it.
The Day Ahead: AM Edition 2021-01-11
Bonds are near short term support at 168^00 and a cycle inflection.
First Look: 2021-01-11
S&P 500 futures have been lower overnight.
The Day Ahead: AM Edition 2021-01-08
Bonds tried to lift from 168^15 but couldn't make it over 169^14 which implies lower in the short term to a new low, perhaps around 168^00 though any new low is good enough for pattern.
First Look: 2021-01-08
The market seems to like the jobs number for the moment but I think we are due for a choppy sideways day.
The Day Ahead: PM Edition 2021-01-07
Bond used an old support at 170^01 as resist today and pushed lower as equities rose during the day.
The Day Ahead: AM Edition 2021-01-07
Bonds continued lower to test the next major target of 168^27.
First Look: 2021-01-07
S&P 500 futures held pretty well overnight and thus think it fair to push for a minor new high today followed by another small correction.
The Day Ahead: PM Edition 2021-01-06
Bonds broke lower today on the assumption that there will be a lot of stimulus will be coming down the pike in the near future.
The Day Ahead: AM Edition 2021-01-06
Bonds have been under pressure this morning.
First Look: 2021-01-06
S&P 500 futures look up again this morning but I'm unsure how high.
The Day Ahead: PM Edition 2021-01-05
The moving averages held yet again today in bonds and initiated a drop out of the bottom of the range.
The Day Ahead: AM Edition 2021-01-05
Bonds were unable to escape the top end of the range and rejected resist at 173^07.
First Look: 2021-01-05
S&P 500 futures started off lower in the early morning but the decline doesn't look impulsive thus inviting a pop up this morning.
The Day Ahead: PM Edition 2021-01-04
Bonds attempted to escape the gravitational pull of the moving averages but couldn't maintain it.
The Day Ahead: AM Edition 2021-01-04
Bonds tested the lower end of the range is has been stuck in early today and now rising to make another stab at 173^07.
First Look: 2021-01-04
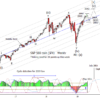
First day of the year and the S&P 500 may be setting a high of some importance.
The Day Ahead: AM Edition 2020-12-31
Bonds have indeed built a little base on top of 172^18 and now rising from it.
First Look: 2020-12-31
S&P 500 futures have been up this morning from a retest of the low from Tuesday morning.
The Day Ahead: PM Edition 2020-12-30
Again, very little real change in bonds today though not that surprising as it was the last full trading day of the year.
The Day Ahead: AM Edition 2020-12-30
Bonds still stuck going sideways. I still favor an eventual upside break but not in a hurry to do so.
First Look: 2020-12-30
Expecting an inside day today in S&P 500.
The Day Ahead: PM Edition 2020-12-29
Bonds were trapped between the daily moving averages overhead and support at 172^14 below.
Weekly updates & other posts
(Public posts are included on this page too.)

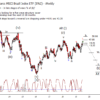
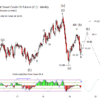
Natural gas starting to simmer…
Opportunities nearby for bulls
The Week Ahead: 2019-09-08
Bonds are stalling just under resist at 167^07 but bears need to have price drop under 162^24 to rule out another stab at overhead targets. The indicators are somewhat mixed here as the cycles are pointing lower but the 9-5 study can accommodate another high. I can't be excited about higher but a little early to be seriously bearish.
Natural Gas via UNG Update
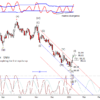
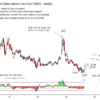
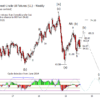
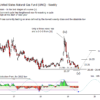
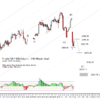
I have been looking for a possible wave (v) low in UNG for the last couple months and it looks like we may have one that sticks. It has spent the last few weeks up from a test, and brief poke under, support at 18.10. Goal now is to establish a five wave move up for an initial impulse up. Resist at 21.81 and 22.89 on the weekly chart. I'm working on the premise that the dominant weekly cycle is inverting and thus for a net rise into the end of the year.
The Week Ahead: 2019-09-02
I like the forming of a doji candle in bonds last week just under resist of 167^07. Both the Lomb Periodogram and dominant cycles suggest softness into October. First step for bears is to drop under 164^00 and even better when under 162^24.

British Pound due for upward correction
It might already have begun
The Week Ahead 2019-08-26
Bonds are testing the 167^03 to 167^27 resistance area again. I favor fading this test and looking forward to a drop to prior resistance at 164^05.

Potential for higher Yen may be limited
It's already retreating from calculated resistance
The Week Ahead 2019-08-18
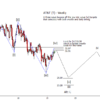
Well, now that bonds moved past the prior high in 2016, what does it mean? It means that the ending diagonal is growing larger and that the move up from the October 2018 low should be comprised of three segments. On the scale of the ending diagonal, spanning ten years, we have yet to see an appropriate sized corrective move for the middle segment of [v], thus must see the current rise as the first segment, (a) of [v].
The Week Ahead 2019-08-11
Bonds have run up to just short of the 2016 but it is holding under it so far. I prefer a lower high to 165^04 but if it pokes to a new high, I will just call this the end of a larger diagonal. Ideally, prices use 162^30 as resistance and fall back to 159^04 or 156^01. Bears need bond prices under 156^01 to take a new high off the table.
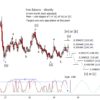
Yen Futures and ETF (FXY) Update – 2019-08-07
Yen has rallied up with gold but I still think the overall Elliott triangle is still valid. It looks like the dominant weekly cycle will be invert and be a high. The ideal cycle infection point is September 13 but we are already in the window. First step for a reversal would be falling under prior resist at 0.009386.

Brazil stocks to break downward
EWZ is in the resistance zone

Italian stocks expected to decline
The upward correction probably won't shoot much higher
The Week Ahead: 2019-08-04
The idea of a lower high in bonds is certainly under stress as bond prices are nearing the 7/8th retrace at 161^09 which is the practical last chance for a wave [ii]. 160^14 which is a fib extension is worth paying attention to early this week.
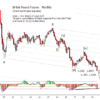
British Pound Futures Update 2019-08-04
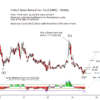
My contrarian frame of mind has me thinking that GBP is working on a major low. Monthly and weekly charts below.
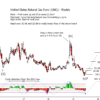
Natural Gas via UNG Update
As you know, I've been watching UNG for a possible significant cycle low nearby and expecting a rise into early next year. While prices have slipped a little lower, that is consistent with the main forecast on the daily chart from the last update. UNG is now near weekly and daily supports and is worth monitoring closely.
The Week Ahead: 2019-07-28
Very busy week coming up with the FOMC on Wednesday afternoon and the NFP numbers on Friday morning.

Yen ETF preparing for a breakdown
out of an Elliott wave triangle
The Week Ahead 2019-07-21
Since bonds do not have a clear five wave impulse down from the rejection of 156^14, I think it best to allow for an attempt to retest resist again into the FOMC meeting. Overall the cyclic position suggests the rise up from last year is late in development.
Natural Gas via ETF (UNG) Update
Making a UNG update since I spent time staring at the daily. First, the weekly chart. Nothing new from when I last posted it. I think UNG is trying to feel out for a low in the 62 week cycle. Price needs to be over 21.65 to cause bears to cover.
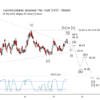
iShares MSCI Italy ETF (EWI) Update
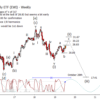
At the start of 2018, EWI ended wave [e] of a triangle and dropped in the first five wave impulse lower at the end of last year. Since then, EWI has been bouncing in a three wave move for a wave (ii). While having tested a possible target at 28.83 two weeks ago, it strikes me as too aggressive to say that wave 'c of (ii)' is complete while above 30.00 as the overhead target tested so far is a bit short of what is typical for a wave (ii).
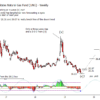
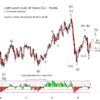
iShares MSCI Brazil Index ETF (EWZ) Update
Treating this overlapping bounce in EWZ up from the low last year as a 'b' wave and expect prices to turn down again in an impulse over the next few weeks.

Dollar Index coiling for a break higher
Traders should watch for a pullback or a breakout
The Week Ahead 2019-07-14
I'm sticking the weekly chart of the Natural Gas ETF UNG here until I spend more time looking at the daily chart at which point I will make a separate post for UNG. I have been looking for a possible wave (v) low develop for the past month or so and while it dropped under the targets I had listed, this does look like a possible low. Until over 21.65 and 22.58 there is a chance they retest the low though if they did, it should be brief.
Japanese Yen and ETF (FXY) 2019-07-09
One of the reasons that I have been skeptical about the gold rise is the correlation that it has had with the Japanese yen and I'm still bearish yen as the triangle is still valid here.
The Week Ahead 2019-07-07
Over the last few weeks, bonds have been forming candle wicks against resist as the two dominant cycles are cresting. I continue to think that bonds are close to reversing lower but need under 153^16 for first confirmation.
The Week Ahead: 2019-06-30
We are starting a holiday week with positive news over the weekend. Wednesday is a half day with Thursday closed for the US independence day. Friday morning is the NFP.
The Week Ahead: 2019-06-23
Cycles and an exhaustion study agree with my wave count that bonds are ready for a reversal. First evidence of a reversal is for bonds prices to drop under prior resist at 153^16.

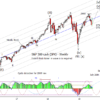
Expect a reversal in treasuries soon
Don't be fooled by the steep rise

Some indices might reach new highs
But truncation also a possibility
The Week Ahead: 2019-06-16
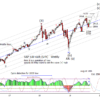
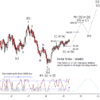
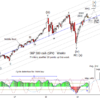
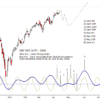
Primary view is that bonds are late in a wave [II] bounce up from the 2018 low. The faster of the two weekly cycle suggest the top is nearby thought the longer cycle could help hold prices up into July or early August. Alternates, not listed on the chart, are that this is just (a) of [II] and there will be a future retest of this resist zone again after a decline in (b) of [II] and a bullish alternate that treats this a wave (a) of an ending diagonal [v]. All the counts can use at least a retrace lower from nearby.

Dow bulls jumped in
right where they were supposed to
The Week Ahead: 2019-06-09
Cycles and the 9-5 study suggest that bonds are ripe for a reversal. At a lower time frame, it is possible the argue for one last small down and up move but very late in the game as price has reached the next set of resist at 155^04 to 155^21.
The Week Ahead: 2019-06-02
Bonds moved from the first target zone to the next last week. Now have an exhaustion signal when the dominant short term weekly cycle it cresting. The longer cycle still has some time left in it but the tailwind should be diminishing.
Natural Gas via (UNG) – 2019-06-02
When I last wrote on UNG, I was looking for a possible truncated wave (v) low in conjunction with a projected cycle low for the year. Prices did in fact climb but was rejected by initial resist at 23.31. Despite that, the overall forecast for a possible low for the year in development is the same.

Dollar ETF building up steam
Leaving the current station soon
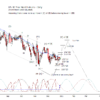
The Week Ahead: 2019-05-27
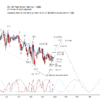
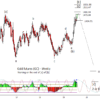
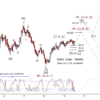
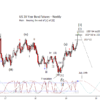
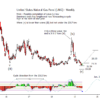
Before looking at the weekly bond chart, I want to draw your attention the this monthly chart of the 30 year yields. Yields finally dropped as expected to a new low on the year and at the top target of 27.61. The next target lower is 26.70 but no guarantee it will reach it. My hypothesis is that we are within a in a few month window that sets the low in yields, and high in bonds, for the year.

Our bearish copper scenario is working well!
It's not too late to find the right trade
The Week Ahead 2019-05-19
Bonds are close to retesting the March high and hence may slow or consolidate a bit but think the bias remains up into at least next month, maybe out to August.
The Week Ahead: 2019-05-13
Plan is for bonds to rise a bit more into July or August to finish wave [ii].
Natural Gas via UNG 2019-05-13
The weekly cycle in UNG has lengthened and is now forecasting a low over the next several weeks and rises toward the end of the year. The daily chart has a five wave count down from the wave iv bounce high in March. Prices rising over 23.31 is first confirmation that the low may be set though it is conceivable that the turn up is slow like in mid 2018.
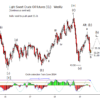
How much longer can T-bonds keep rising?
Is your seat belt fastened?
The Week Ahead 2019-05-06
Well, interesting start on the week as the trade news has dropped the S&P futures 50 points and bonds up a handle as each jumps in the direction according to forecast.
The Week Ahead: 2019-04-28
Second week of bonds holding support at 146^29 bodes well for a rise into July or August for wave (c) of [ii].

Brazilian stocks unable to climb out of range
Is it time for the reversal?
The Week Ahead: 2019-04-21
Bonds trying to regain its footing against 146^29. I put more emphasis on the longer cycle on this chart which continues to climb into August over the shorter cycle which is topping out now.
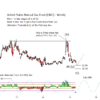
AT&T Update 2019-04-21
My power went down for about an hour last week and prompted to pick a book off my bookshelf to read by the window till the power came back on. After the power came back up, I had asked in the chat room if there was any favorite stock that anyone wanted me to look at with through the lens of a technique that I just re-read about. AT&T (T) was suggested so below are my thoughts on (T) and some analysis using a Gann timing technique.

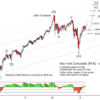
NYSE bullish in 2019?
The bounce has been impressive but not surprising 🙂
The Week Ahead: 2019-04-14
Tricky position in bonds as we are approaching the next weekly cycle inflection. I prefer that to be used as either a wave iv or as 'c of (b)' both of which call for higher bond prices over the next several months.
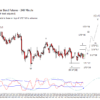
The Week Ahead: 2019-04-07
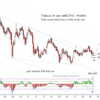
Before looking at the weekly bond chart, how about a peek at the monthly 30 year yield chart. The dominant cycle on this chart suggests a low in yields for the year being set in the next few months. This is compatible with the bond forecast.
Natural Gas via UNG Update 2019-04-07
UNG has dropped from January 16th and from the next pop up in early March which is consistent with the forecast for lower from a wave iv bounce. Both weekly and daily cycles suggest an inflection point is near but price is not as deep as I'd like it. Since we now have prices back into the range UNG was in for much of 2018, I'm not confident in much lower prices but neither can I say lower is impossible. Disclosure, Natural Gas is my kryptonite, it is the market I have the most difficult time with, so take this accordingly, but I think we are in an area where a long trader can begin to accumulate.