All the U.S. stock indices have sustained major losses during the past three months, but the Elliott wave count is not necessarily bearish. Among the major indices, the decline was least severe in the Dow Jones Industrial Average, where it looks like a reasonably proportioned fourth-wave correction.
The Russell 2000 looks worse than the Dow, but even that index has a “last ditch” prospect of support nearby.
This post shows some of the crucial areas to watch for confirmation of a bullish scenario in both the Dow and the Russell 2000. Although we cannot rule out the possibility that stocks have already put in a top, we encourage traders to keep this scenario in mind when the market tests the levels shown.
An optimistic wave count for the Dow
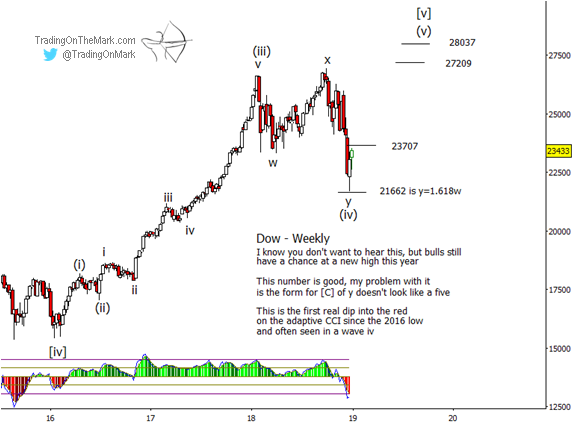
As we have written previously, we were expecting the major indices to produce impulsive (five-wave) moves up from their 2016 lows. With the Dow, the Russell 2000, and the S&P 500, the climb from 2016 actually counts better as three waves rather than five.
In a scenario where the Dow might have spent 2018 working through a fourth-wave correction, it’s important to note that price bounced at a very important 1 x 1.618 Fibonacci level near 21662. Moreover, wave (iv) is nicely proportionate to wave (iii), and it also obeyed the Elliott wave rule of thumb by testing near the area of the previous wave ‘iv’ of smaller degree.
Volatility is increasing across all of the market sectors we watch at Trading On The Mark. We can help you prepare for the 2019 trades with a whole year of chart support, and right now you can lock in a year of deep 25% savings with the special subscription package that’s still available for a few more days.
Is the Dow ready to rocket to the moon now? Maybe not. The more recent decline from December 2018 would ideally consist of five waves, but so far it only appears to have three waves. That leaves room for another test of support and the printing of a slightly lower low before the bulls regain control.
The nearby resistance that traders should watch for bullish breakout confirmation is near the 23707. The upward scenario would gain credibility with a weekly close above it.
However if an upward break is in store, it might happen this week. There could be a second test of support before the resistance is challenged again.
An (even more) optimistic count for the Russell 2000 ETF
With the iShares Russell 2000 ETF shown below, an Elliott wave count up to the 2018 peak fits better with the idea of three waves to that point rather than five. That would leave room for one more push to new heights.
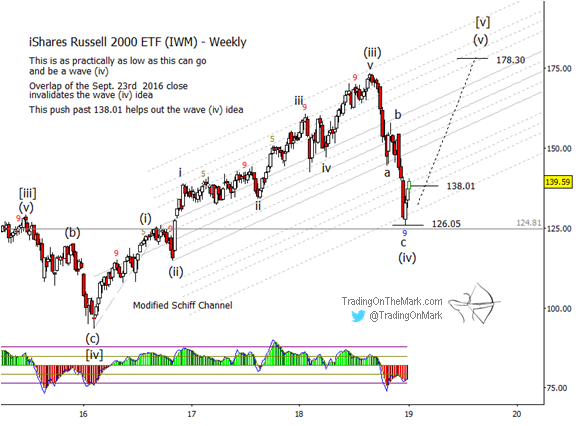
In order for the recent decline to be a fourth wave in IWM, the downward wave (iv) should not have much overlap with the high represented by wave (i) back in September 2016. Specifically we would not want any weekly close at this time to be beneath 126.05. As you can see on the IWM chart, the index bounced strongly from an initial test of that area.
Just as we were watching for a five-wave move up from 2016, we also expected to see a five-wave downward move on a smaller scale from the lower high that IWM printed in early December 2018. Since the recent downward move counts better as three waves rather than five, the case for this scenario would be stronger if IWM were to test the support near 126.05 a second time and then bounce again.
As we mentioned earlier, this is a scenario for traders to keep beside their desks. The prospect of another high this year is far from certain, but this article shows where the major turns and confirmation events could happen if the bullish scenario really does kick in.
If the decline really does turn out to be a fourth wave correction as described here, the first area where a trader might watch for breakout confirmation would be above the resistance at 136.91, which is the Fibonacci 38.2% retracement from the high of recent wave ‘b’ to the low of recent wave ‘c’.
Happy new year and good fortune in your trading!