With the FOMC meeting this week, the price of long-term treasuries is reaching our target area at an interesting time. This edition of the free newsletter from Trading On The Mark offers readers an exclusive update for bond futures, with a main Elliott wave scenario and alternates. We also review recent developments in the related ETF.
All of our scenarios for treasuries are bearish in the near term. At this point the important questions for traders are how far the forthcoming decline will stretch and how consistent it will be.
The steep rise has been impressive, but it can also be misleading.
The rapid advance in treasuries in recent weeks looks to us like the type of “blow off” move that precedes a reversal. Note that price has followed the upward path we showed to newsletter readers in May, behaving as we would expect for wave (c) in a three-wave pattern.
Our main scenario is shown below with price currently reaching the end of wave (c) of [ii]. We expect this to be part of a much larger [i]-[ii]-[iii]-[iv]-[v] impulsive structure that should eventually lead much lower. This view is supported by the fact that the charted price acted as though it was reaching a major top in 2016, consistent with the Elliott wave count we had been following for several years.
The resistance target areas shown on the chart apply to the main scenario as well as the alternate ones we describe later in this piece. They represent a minor update of the targets we showed in the previous newsletter.
Specifically we note that price recently broke above the resistance zone that extends from 153^16 to 153^30. Now we are watching to see if that zone can act as support. If it fails we would expect a downward cascade.
Last week price began testing the higher resistance zone that extends from 155^04 to 155^18. If price breaks through, then we will watch it in the same way we described previously for the lower zone.
Beyond that, important Gann-based resistance awaits at 156^14.
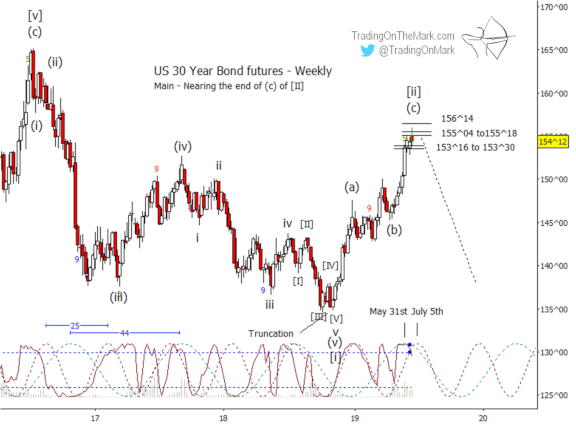
Other considerations right now include two price cycles that are visible on the weekly chart with periods of 44 and 25 weeks. Both are currently near their crests, which favors a downward reversal soon. The ideal inflection point for the faster cycle is the week of July 5.
The Lomb periodogram is also shown on the chart above, and it indicates that the rally may be reaching exhaustion on a faster cyclic time frame too.
If that isn’t enough, we also note that the Wave59 proprietary “nine-five” movement counter produced a “gold 5” exhaustion signal two weeks ago.
Alternate scenarios, still bearish
Our first alternate scenario is also bearish in the long run, but it could produce a near-term decline that isn’t as powerful as the one shown for our main scenario. The chart below shows how the three-wave rally since late 2018 could simply be wave (a) of [ii] instead of comprising the entirety of wave [ii].
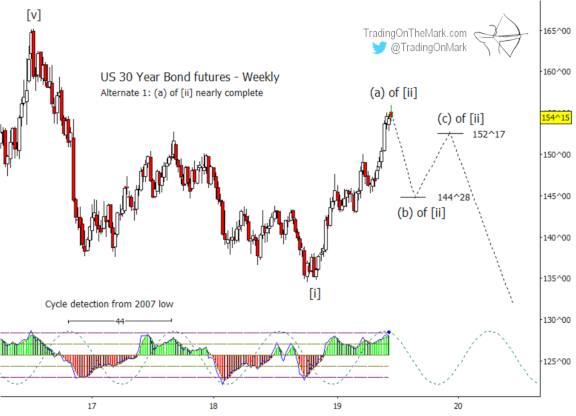
On the chart for the first alternate, we have drawn a more complex wave [ii] in a way that produces a lower high. That is somewhat unusual, and it is not a certainty. It reflects our generally pessimistic outlook for interest rates and also the idea that because price is currently testing a major resistance area it might not need to test it again later.
Potential support near 144^28 could produce a bounce. We would consider the first alternate scenario to be alive until that level has broken.
Our second alternate is long-term bullish, even though it calls for a sizable decline from the current area just as the other scenarios do. The chart below shows how it might look if the three-wave rally since late 2018 was the first part of a five-wave rising diagonal pattern. That scenario would lead price eventually to test and probably exceed the 2016 high.
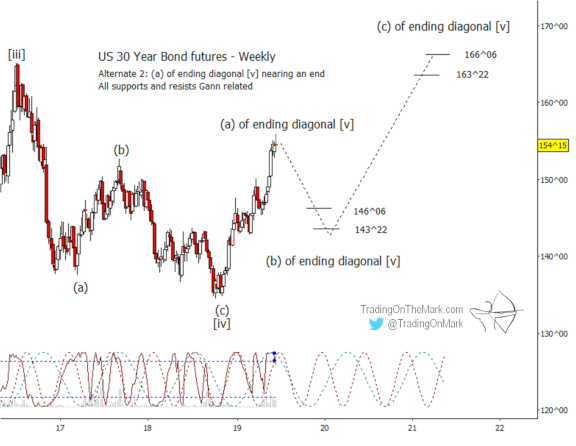
Even if price is forming a rising diagonal as imagined for the second alternate, the pending wave (ii) of that diagonal would take price down to test and probably reach into the support regions near 146^06 or 143^22. The way to rule out either of the alternate scenarios will be to see whether a price decline begins to take on an Elliott wave “impulsive” look.
Areas to watch for the ETF
The chart below shows what the main scenario for bonds looks like when translated for the iShares 20+ year Treasury Bond ETF (symbol TLT). Major resistance targets include 131.71 and 133.90, with the lower one already being tested.
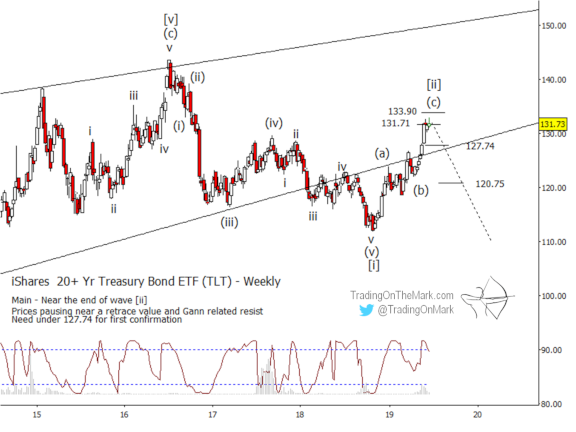
A break of support at 127.74 and the nearby supportive trend line would serve as preliminary confirmation that a downward reversal is taking place in TLT. Failure in that area should produce a relatively rapid journey to the next support at 120.75.
You’re trading with an advantage when you have up-to-date charts. A Daily Analysis subscription at TOTM gives you constant access to up-to-date with charts on weekly and daily time frames for the Euro, the Dollar Index, gold, crude oil, bonds and the S&P 500. Intraday Analysis offers additional moment-by-moment coverage of the S&P 500, ES futures, and related markets along with more detailed charts for the other instruments.
Good fortune to you in your trading!
— Tom and Kurt at Trading On The Mark