This is a quick update for newsletter readers to show how the natural gas forecast is holding up. (Quick answer: it’s working well.)
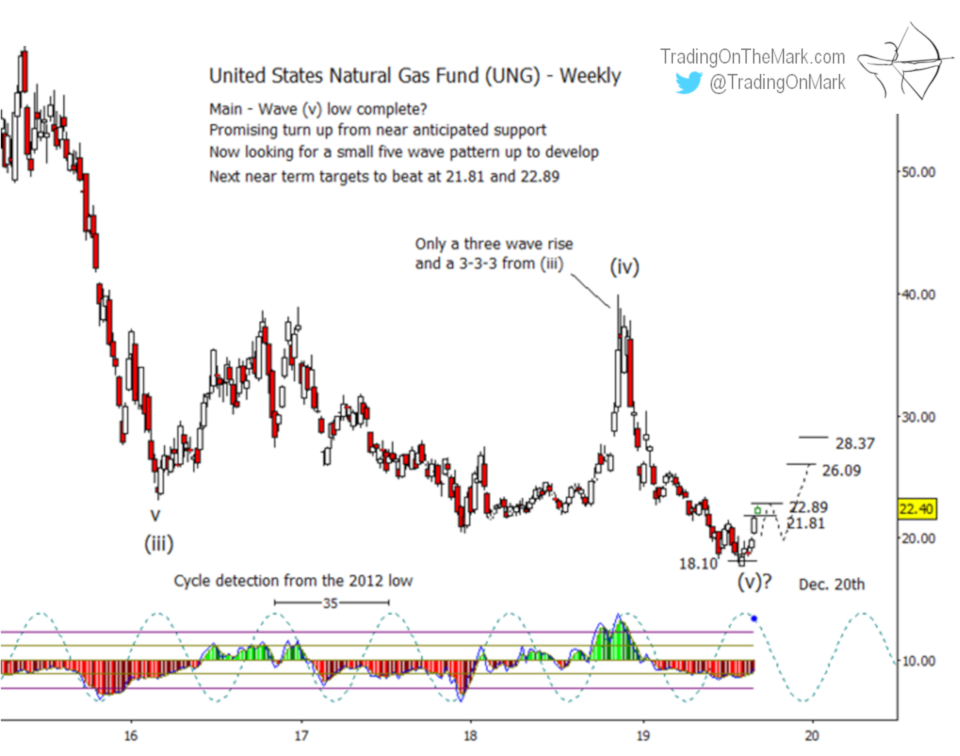
In our July 31 email about the United States Natural Gas Fund (symbol UNG) we described a five-wave impulsive count down from the November 2018 high, and we indicated that the pattern appeared to be nearing completion. The main support we showed was at 18.10.
A few days after our email, UNG poked slightly beneath the support for a few hours before recovering. Now it has reached the resistance area (21.81 to 22.89) whose failure could provide initial confirmation of an upward reversal.
So far, price movement is behaving as though the low in early August was a reversal point. Note how that also coincided with an inflection in the 35-week cycle that has been operating since 2012. It also fits with an inflection of the 64-week cycle that we showed on the chart in our earlier email.
It is reasonable to think the resistance at 22.89 might allow for a small downward retrace. Bulls will view that retrace as a buying opportunity.
There’s considerably more information on a daily chart to support trading decisions right now. A faster price cycle, geometry, and more finely tuned resistance/support levels highlight certain areas as good entry points.