Our message to newsletter readers in July was to watch for an inflection and possible reversal in two international ETFs. That plan appears to be working so far, and one of the funds might already have begun forming a bearish impulse.
Here we show some refined targets and levels with turnaround potential for the Italian stocks ETF. We also check up on the Brazilian stocks ETF, which might already have put in the corrective high that precedes a strong move lower.
Italian stocks might need to climb a bit higher in their corrective pattern. Here we revisit the iShares MSCI Italy ETF (symbol EWI).
Recall that our July email showed how EWI was trying to resolve the middle part ‘b’ of an a-b-c corrective pattern and move onward to the final upward leg ‘c’ of the correction. We suggested that a break of support at 26.00 was needed in order to say the entire corrective pattern was finished. Although the support was tested, the breach was short-lived. The support seems to be working as a platform for the wave ‘c’ bounce.
On the updated chart shown below, we have measured out some Fibonacci extension resistance levels based on the view that the smaller corrective ‘b’ wave low is set.
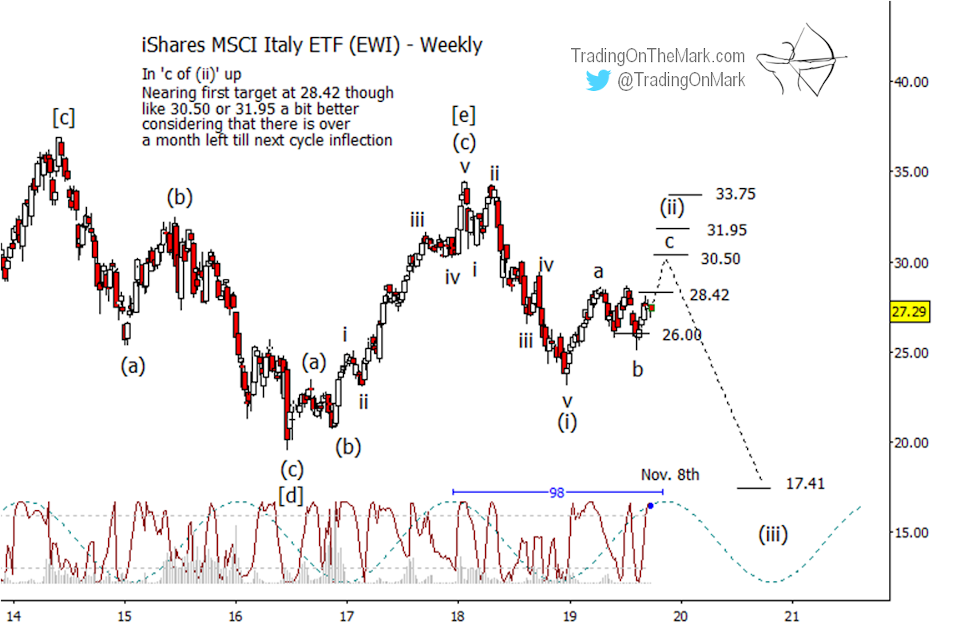
The next question is how high wave ‘c’ can reach. Knowing the magnitude of rising wave ‘a’ and now knowing how far down wave ‘b’ reached, the standard Fibonacci levels that might cap wave ‘c’ include 28.42 (currently nearby), 30.50 (the 1 x 1 measurement), 31.95 and 33.75.
The way price behaved near support at 26.00 illustrates one of the considerations that traders should keep in mind during the next several weeks. Although price moved beneath support for a brief time, it didn’t make a weekly close that was much beneath the level. The best that bears could manage at the time was a weekly close just a few cents below 26.00. No doubt some bullish traders exited prematurely or had their stops hit, but the more patient bull would have noted how support was never broken decisively.
Similarly, a potentially bearish trader might watch for signs that a break of resistance is “sincere” before giving up on a position that had a good entry price.
The updated chart also includes a slightly updated price cycle that should peak around the early part of November. Price cycles are rarely exact, but this one suggests that EWI should be allowed more time to test the nearby resistance and perhaps also the next resistance levels before traders play for a reversal.
As we mentioned in our July email, a very preliminary downward target sits at 17.41 for wave (iii) out of the expected reversal.
Meanwhile, Brazilian stocks might already have made the corrective pattern high.
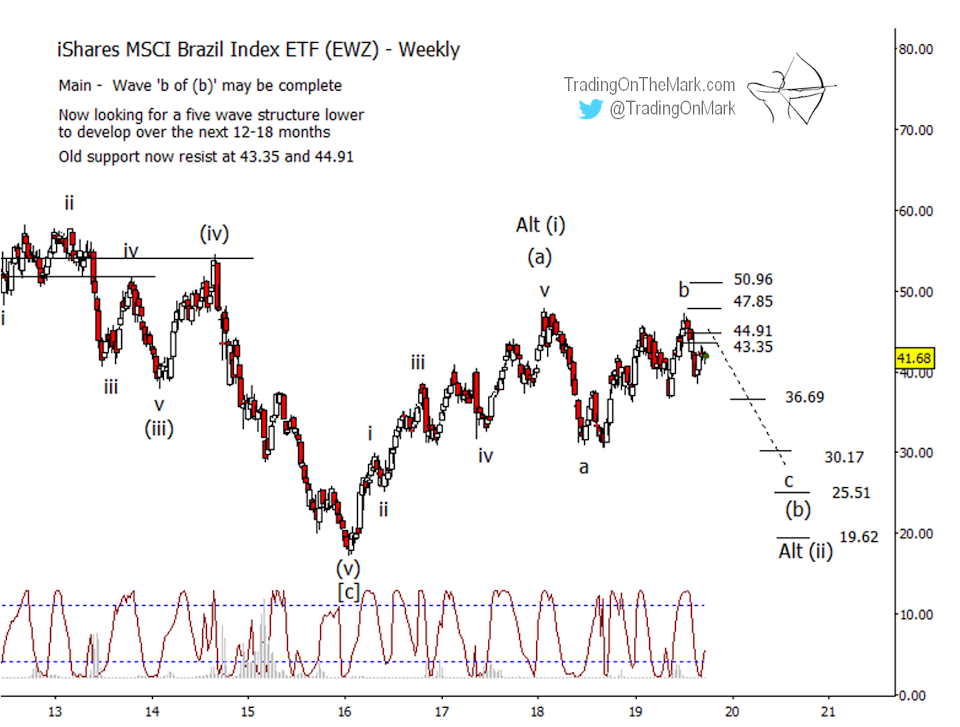
When we last visited the MSCI Brazil Index ETF (symbol EWZ), we pointed out that the highly adaptive Lomb periodogram was suggesting a downward reversal just as price was testing near important resistance. The resistance has held so far, and we might now be seeing a small upward retrace that could be favorable for Brazilian bears.
On the updated chart key resistance levels are marked at the same prices we showed earlier. We believe the Elliott wave pattern has been working through an upward corrective wave ‘b’ that might be complete. Resistance at 47.85 appears to have worked, although a fallback resistance level at 50.96 could come into play if price breaks higher again.
The levels at 43.35 and 44.91 should be viewed as broken supports, and the near-term bearish case looks healthy as long as that zone caps any upward retracement.
The Lomb periodogram that we showed in the previous article coincided nicely with the provisional b-wave high, but we realize most readers don’t have access to that indicator. (It’s included as part of the Wave59 charting software that we use.) At the present time a 14-period fast stochastic indicator gives almost the same plot of the relatively fast cycles at work on a weekly chart of EWZ.
If the Lomb periodogram or the stochastic indicator move back to the upper zone in conjunction with a lower price high, that would represent a reasonably good entry signal. However the indicators are not guaranteed to swing back upward in that way, so traders should also pay attention to the way price behaves near the support-turned-resistance lines.
If the b-wave high is set, as we believe, then we should see an impulsive (five-wave) downward move to test the lower supports shown on the charts. The support at 36.69 might produce a pause in any decline, allowing bears to take profits or manage their positions. Next supports at 30.17, 25.51 and 19.62 represent more important areas to watch as ultimate targets of the downward impulse.
If this wave count continues to work as well as it has been working, then EWZ should try to plant a durable low sometime during the next one or two years, and that low should be higher than the low printed in early 2016.