Our overall bullish analysis of the U.S. Dollar Index has met with success for several years running. Now, after about four months of correction, the index is at an area that could produce a strong bounce. However a failure of support in the current area would foretell several more months of decline or sideways correction.
In this piece we show how the main bullish Elliott wave count and the alternate, less urgently bullish count might unfold in the Invesco DB US Dollar Index Bullish Fund (NYSEARCA: UUP).
Patterns and price action in UUP are strongly correlated to those in the Dollar Index, but the two issues don’t line up perfectly with each other. Even so, each follows its own internal logic and each follows Elliott wave rules and conventions. Our big-picture charts and wave counts are quite similar for the two.
Our count of an upward impulsive pattern in UUP begins in 2011. We believe price is currently working its way upward through the final wave [v] of the sequence. Our main scenario and alternate scenario both fit within that perspective, as shown on the monthly chart below. The scenarios differ as to whether corrective wave (ii) of [v] is complete or not.
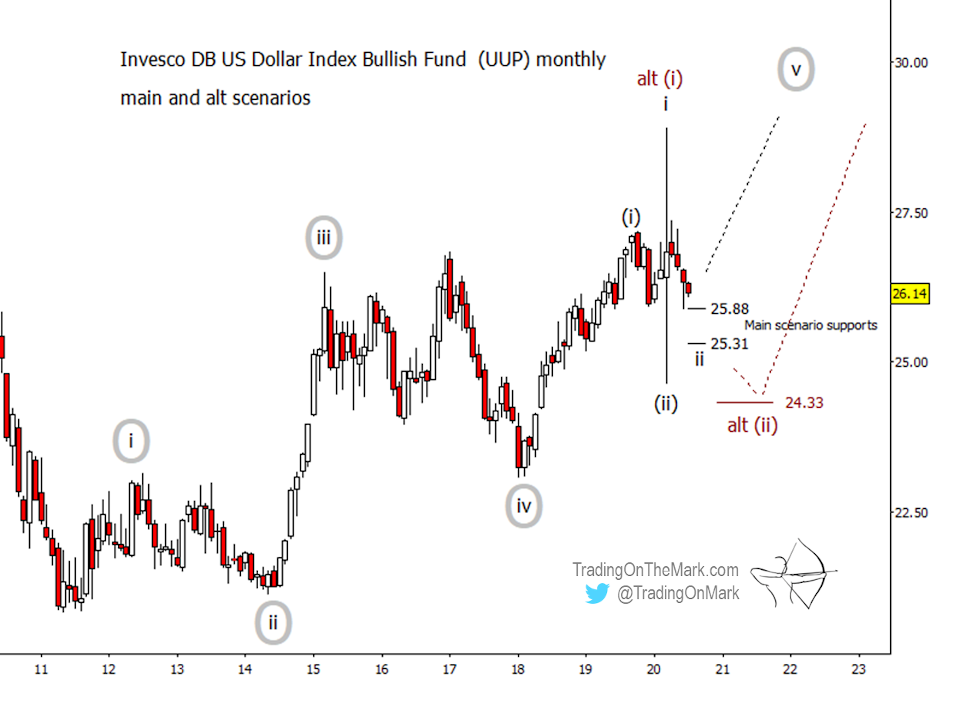
For our main count to keep working, UUP would need to find support nearby and embark on upward sub-wave (iii) of [v]. Conveniently, price has found initial support at the 61.8% retracement of what we believe was sub-wave (i) of [v]. We would like to see that support at 25.88 hold, although the main scenario could still work if price were to gain its footing at 25.31, which corresponds to a 78.6% retracement.
A failure of nearby supports would suggest that price is still working its way through sub-wave (ii) of [v]. In that case, we would expect a breach of 25.31 to lead to an eventual test of 24.33, which represents a 61.8% retracement of the wave labeled as alt (i).
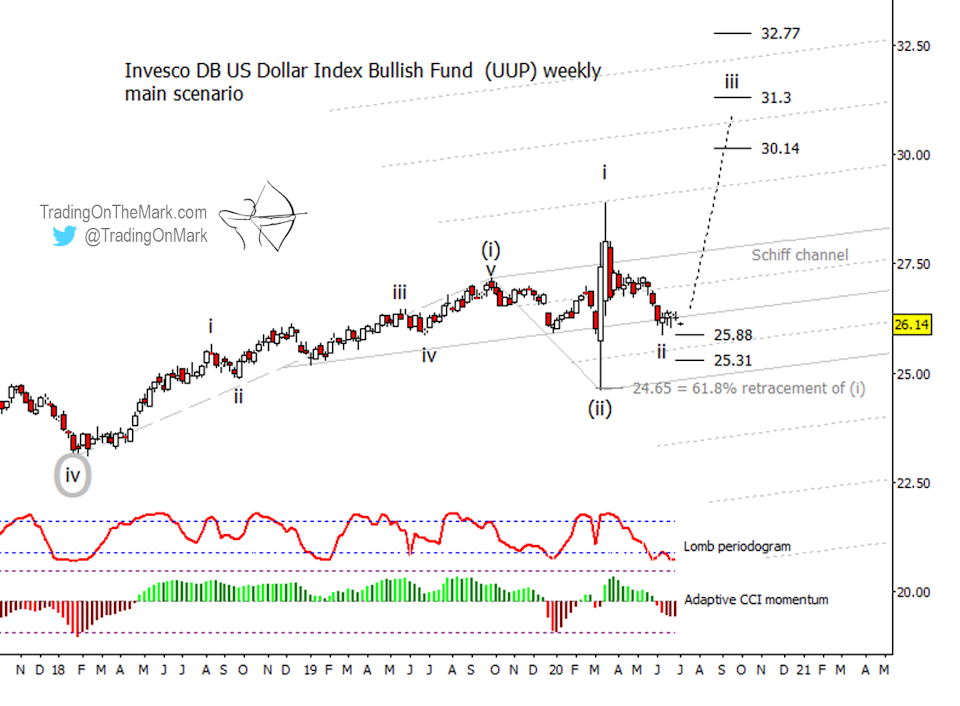
A more detailed weekly chart, below, shows some preliminary upward targets for UUP if the main scenario produces a bounce from the current area. Standard Fibonacci extension relationships would have sub-wave iii of (iii) of [v] test the areas near 30.14 and probably also 31.30. It could even reach as high as 32.77 before putting in a serious correction. Remember, third waves are typically the strongest in a sequence, and the “middle third” of a third wave can be quite powerful.
When we apply the Lomb periodogram as a fast-response cycle detection tool, it signals that price may currently be near a low.
The weekly chart shows some additional factors that we believe favor our main scenario over the alternate. Note how nicely the Schiff channel works when anchored to waves (i) and (ii). The subsequent rise of sub-wave i of (iii) was capped precisely at the first harmonic of the channel. Note also that wave (ii) made a nearly exact 61.8% retracement of wave (i).
Keep in mind that the main scenario should start to kick in very soon if it’s going to work at all. A delay beyond this week would lend weight to the alternate scenario.
Trading On The Mark provides detailed, nuanced analysis for a wide range of markets. With a Daily Analysis subscription, you get twice-daily updates for heavily traded markets including the Euro, gold, crude oil, bonds and the S&P 500. The Intraday Analysis subscription offers additional moment-by-moment coverage.
Good fortune in your trading!
– Tom and Kurt at Trading On The Mark