A month ago we published monthly and weekly charts showing the SPDR GLD Shares fund (NYSEARCA: GLD) as being near the end of its five-year ascent. That’s still our view, although price has overshot the target resistance zones.
This brief update shows some resistance areas to watch on weekly and daily time frames.
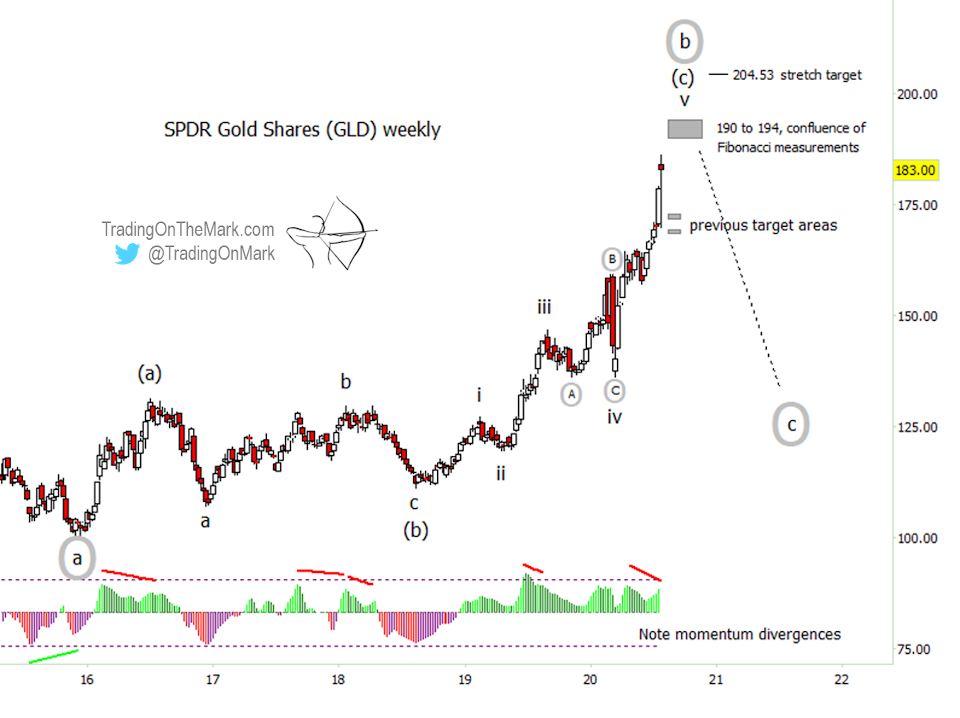
In the big picture, the structure of our main Elliott wave count remains the same. However we have added some notations on the momentum indicator showing important price/momentum divergences that have preceded reversals and pullbacks during the past five years. One such divergence may be forming place right now.
On a weekly chart there’s a set of Fibonacci-based resistance levels ranging from 190 to 194, making that a candidate area for GLD prices to peak. Another Fibonacci-based level at 204.53 could represent a “stretch target” if price overcomes the first area.
On a daily chart we are monitoring the steep ascent of what we believe is sub-wave [III] of ‘v’. Note how price has interacted with the ladder of Fibonacci resistance levels that are based on the length of previous sub-wave [I]. Traders working on this time frame often use those types of levels to initiate buys and sells. As you can see, the levels would have worked well in terms of planning exits from relatively quick long trades.
Sub-wave [III] has tested the resistance line at 185.33, and it is uncertain whether it can reach the next one at 193.03 before a correction kicks in.
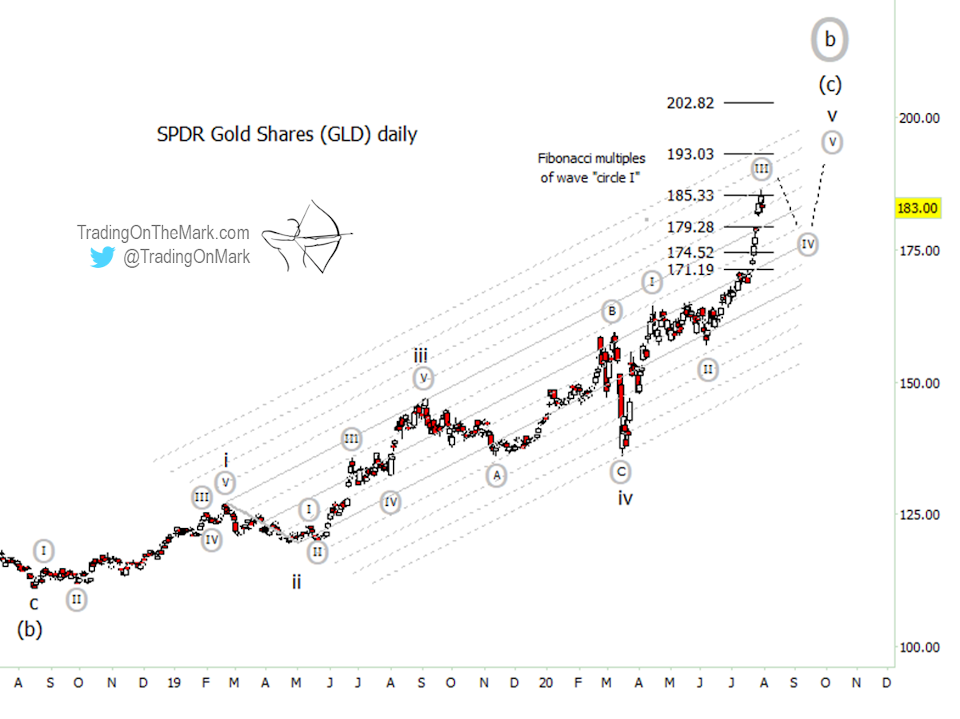
When a small wave [IV] eventually forms, it could take price back down to test the upper or middle sections of the channel shown on the daily chart. For illustration we have placed the [IV] label near what would be a Fibonacci 38.2% retracement of wave [III]. That would leave GLD poised to try for one more new high before a major reversal.