During the past several years, we have emphasized each major pullback in equity indices as a buying opportunity and have avoided long-term bearish pronouncements. Now, finally, we see possibly completed upward patterns in each of the major U.S. indices simultaneously.
Investors who have been long-term bullish on stocks might use this opportunity to rebalance their portfolios defensively. Meanwhile, traders should begin recognizing a higher risk with any bullish trading bias, and they should be prepared to shift to a bearish bias if certain supports break.
When the market sees its next major pullback, perhaps early in 2021, you WILL NOT hear us screaming about a buying opportunity. It’s possible (but not certain) that a long-term top is forming now at the end of 2020.
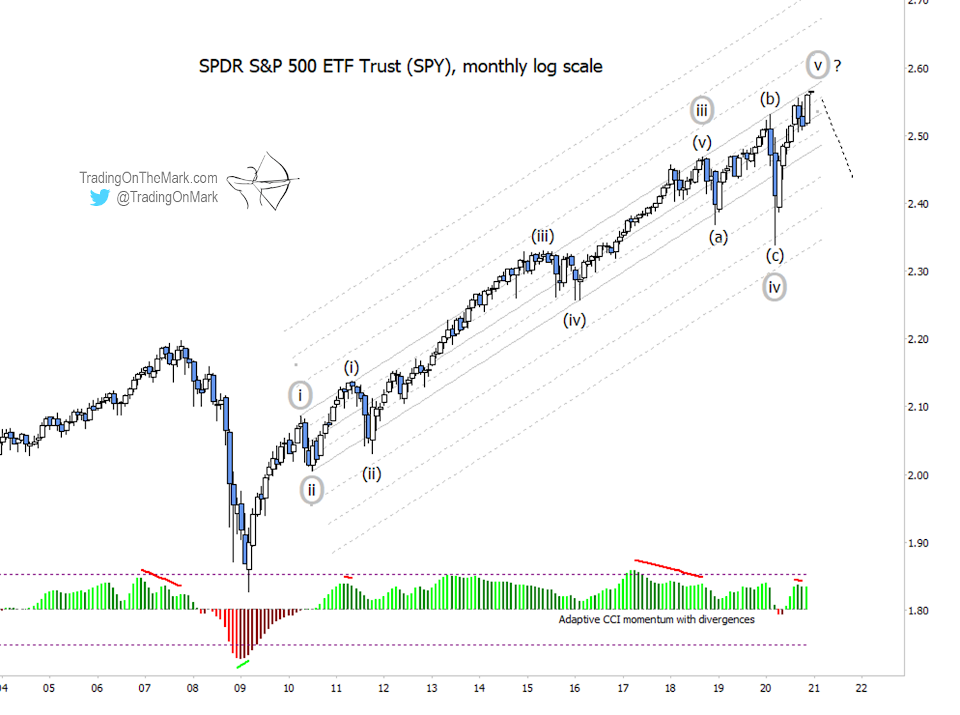
Let’s turn first to the S&P 500 Index via the SPDR S&P 500 ETF Trust, NYSEARCA: SPY. On a monthly chart (shown in logarithmic scale), you can see the possibility of five complete waves of the magnitude
[i]
-[ii]-[iii]-[iv]-[v], with the brackets denoting circled markers on the chart.
At the next smaller magnitude, there also might be five completed waves upward from the March 2020 low.
While we have been monitoring this development in SPY, we also have been watching the Dow Jones Industrial Average, the Russell 2000 Index, and the NASDAQ 100 Index. Now is the first time all of them show have showed possibly complete upward patterns from the 2008/2009 lows. We’ll discuss some of those indices in future posts.
On the monthly chart for SPY, note the instances of momentum divergence that have coincided with major turns. A similar divergence could be forming now, although confirmation might look better after the December close.
Also note the times when the momentum indicator veered into negative territory. Often that behavior marks the fourth wave in a five-wave bullish sequence. Provisionally we are treating the 2009 SPY low as a higher-degree fourth wave, and we believe the March 2020 low was a fourth wave of the next smaller magnitude.
If a major correction were to begin from the current area, we would expect it eventually to reach into the territory between the 2007 high and the 2009 low. It could reach even lower. (However it’s important to keep in mind that we do not yet have any confirmation of a high being in. Don’t get too bearish prematurely.)
A weekly chart with a regular price scale shows us where the next practical trades could be. There’s a possible five-wave (i)-(ii)-(iii)-(iv)-(v) structure up from the March 2020 low. We have marked resistance areas for wave (v) of [v] based on the magnitude of the earlier wave (i).
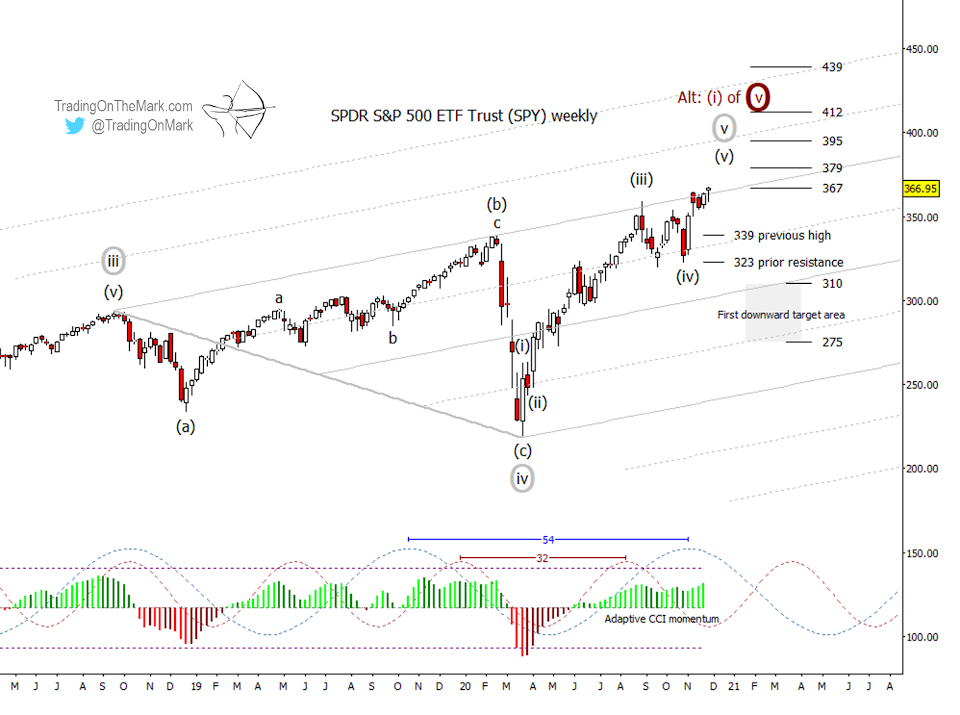
The major 54-week cycle has an inflection during the first week in December. The next most dominant cycle of 32 weeks has an ideal high late in March 2021. Either of those could inform the timing of pattern completion up from the March 2020 low, and we have a preference for the earlier date.
Early confirmation that a sizable retrace might be occurring would come with a break beneath the early-2020 high at 339, which we are treating as wave (b) of [iv]. Better confirmation would come with a break of the earlier resistance that later became support at 323. We mentioned that level in previous posts.
A downward retrace should have a preliminary target area of between 38.2% and 61.8% of the climb up from March 2020, which currently is the range between 310 and 275. However if the top really is in, then that area will be a mere stepping stone in a larger downward journey.
It’s important to keep an alternate wave count in mind. Even if SPY finds an intermediate top nearby with five waves up from March, that won’t necessarily mean the entirety of wave [v] is complete. The advance of 2020 could be just sub-wave (i) of [v]. That would allow the indices to move considerably higher during the next three to five years. In that scenario, we would have to change all our wave markers after March to be one degree lower than is currently shown on the weekly chart. Our general reading of the economy suggests that the stock market is not poised to make great leaps upward during the next few years, but the technical methods used here don’t rule it out.