As traders start coming back to their screens after the holidays, we are posting some longer-term forecasts for several of the markets we follow. Near the top of our “alert list” is the Yen/Dollar currency trade as charted with the CurrencyShares Japanese Yen Trust (NYSEArca: FXY).
You can view more of our forecasts in our newsletter. Request your copy here.
When we wrote about FXY last spring, we suggested that price would not rise by much during the rest of 2017. That turned out to be correct. The upper boundary of the descending channel on a monthly chart has proved to be effective resistance.
Now price is putting stress on a supportive trend line, forcing a squeeze between support and resistance. We believe price will fall beneath support to test new lows during the next few months. A decline from nearby would is the most probable next step in the large five-wave [i]-[ii]-[iii]-[iv]-[v] pattern that began in 2011.
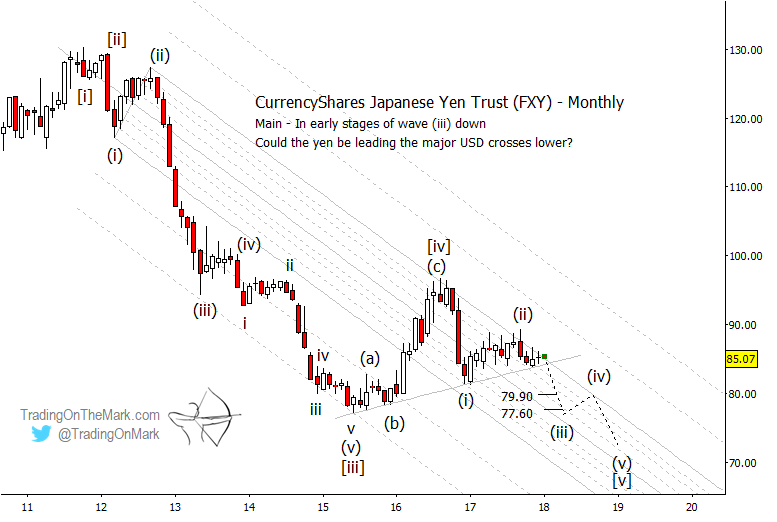
In our main scenario for FXY, the pattern down from the 2016 high should consist of five sub-waves. A break beneath trend line support would represent the first confirmation that sub-wave (iii) of [v] is underway. Fibonacci extension targets for this leg of the decline include 79.90 and 77.60, with the prospect of the next leg reaching even lower.
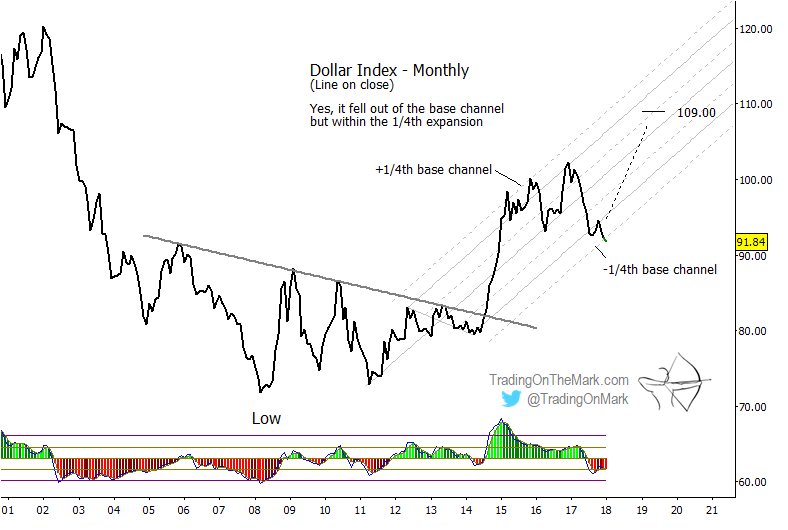
For context, note that the Dollar Index is testing the supportive edge of a rising channel as shown on the line-on-close chart below. The end of 2017 also represented a trough in the dominant cycle (not shown) for the Dollar Index. A Dollar rally from nearby would be consistent with a decline in the Yen and FXY.