With a break and consolidation beneath long-term channel support, we believe the trend for treasury bonds has shifted. Traders should now view bonds in the context of a bearish market.
A line-on-close chart with monthly data points illustrates the idea. For several years, the upward sloping channel worked remarkably well for swings in both directions. Meanwhile the Elliott wave pattern during the long rise counted well as a five-wave ending diagonal – a terminal pattern.
With the diagonal form completed in mid-2016, price moved rapidly to test the lower boundary of the channel and then to break beneath it.
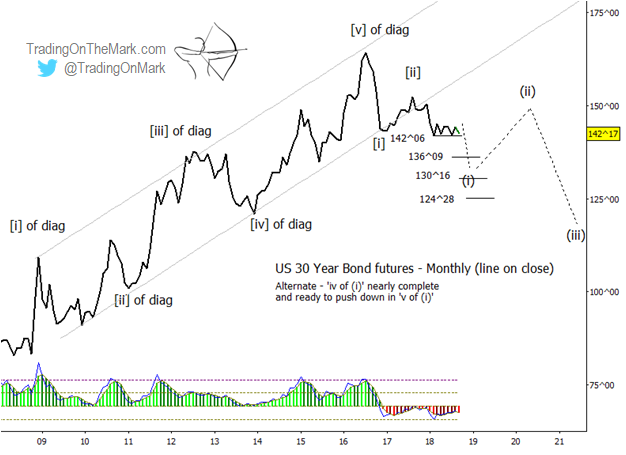
Right now, it is a point in bears’ favor that, rather than retracing to test the broken channel from below, price is instead consolidating near a Gann square-of-nine support at 142^06. A break of that level would serve as even better confirmation of a bearish scenario.
The Elliott wave count shown here for the newly declining pattern represents our alternate scenario, but it still serves to highlight areas to watch. In both our main and alternate scenarios, the first two support zones below current price are similar.
Trading On The Mark subscribers receive twice-daily updates for the Dollar Index, Euro futures, the S&P 500, crude oil, treasury bonds, and gold. If you’re new to TOTM, sign up to get our free newsletter and follow us on twitter to get timely updates for treasuries and other markets.