Natural gas prices can be as volatile as the material itself, and we expect to see some of that volatility in coming months. Here we show how it might play out for the United States Natural Gas Fund (NYSE Arca: UNG).
From the early 2016 low, price action into late 2018 counted as corrective from an Elliott wave perspective. In larger context, that corrective pattern was probably wave (iv) of a downward impulsive move. To complete the large impulse, we should see a downward wave (v) that is itself impulsive.
On a weekly chart of UNG you can see that the impulsive structure of wave (v) may already be complete. That’s our alternate scenario, and it would imply that price should start climbing from nearby.
However our main scenario calls for another poke slightly lower. That view is based on a more detailed daily price chart, not shown here. We have sketched a rough path for our main scenario on the weekly chart below.
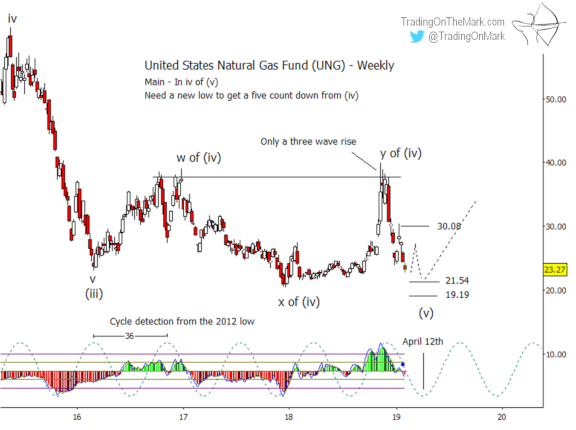
Note also that we’re approaching an inflection in the 36-week cycle. The ideal timing for a reversal would the week of April 8-12.
If price is going to make a durable low soon, some Fibonacci-related supports to watch include 21.54 and 19.19. Keep in mind that reversals in natural gas and UNG tend to be quick.
Follow Trading On The Mark on Twitter for more frequent updates about ETFs and futures! In coming days, readers of our free emailed newsletter will also receive exclusive content and opportunities to save on TOTM subscription packages.