Copper futures recently tested the resistance area we had identified in February. In fact that area produced several opportunities for bearish traders to get in on the anticipated strong decline.
Now that bears have made their initial move, we show some areas to watch for possible downward continuation.
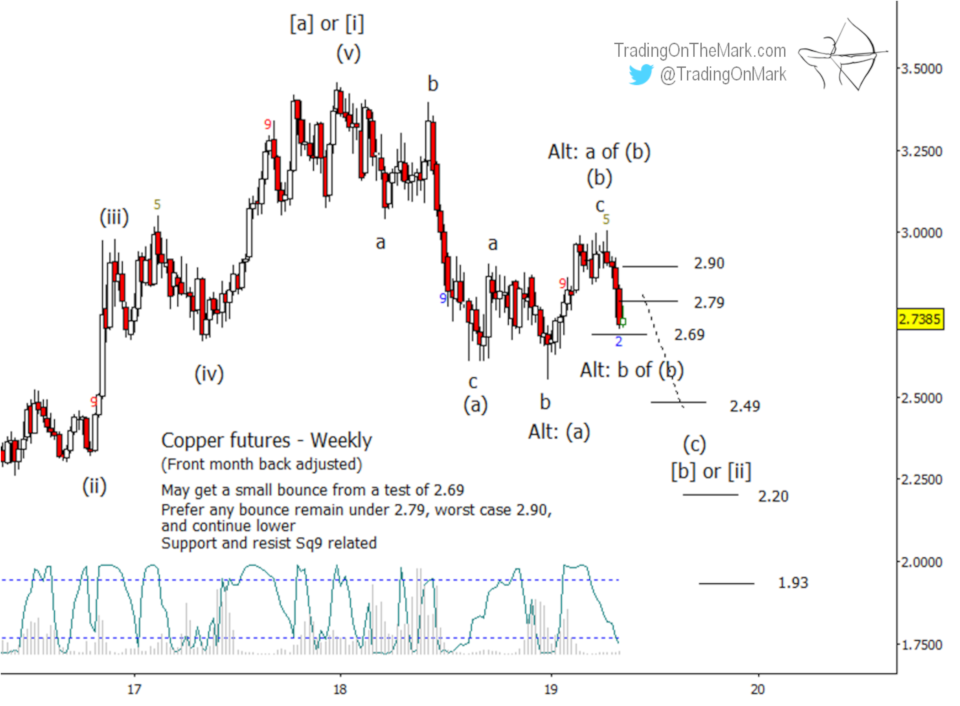
Our main Elliott wave scenario treats the recent drop as the start of what should be wave (c) of a three-wave (a)-(b)-(c) move. Readers at See It Market might remember that we predicted a similar path for the Global X Copper Miners ETF (NYSEARCA: COPX) when we wrote about it in November.
As our readers know, any move that occupies a ‘c’ position in a corrective pattern is likely to be a strong one. In this case we believe the correction began in December 2017 and has already moved through waves (a) and (b).
The Gann square-of-nine measuring technique often works well to find support and resistance levels with copper futures and precious metals. Right now a Gann level at 2.69 waits as possible support for a small bounce.

Wojtek the Soldier Bear
The cover image features the Edinburgh, Scotland sculpture of a bear that served in the Polish military during World War II.
_statue_in_Princes_Street_Gardens.jpg)
The highest reward/risk opportunity might be to watch for one of the Gann resistance levels to hold near 2.79 or 2.90. That could lead to another strong decline as the “middle third” sub-wave of (c).
Note that the Lomb periodogram at the base of the chart is starting to reach the area that could coincide with a bounce or consolidation. The Lomb is a relatively fast-response way to estimate the timing of price cycles.
Our alternate scenario would have the consolidation that began at the start of 2019 continue for several more months. In that case price would probably test and exceed the recent high. There is no way to predict the exact path the alternate scenario would take on a chart, but traders can watch for specific clues along the way.
For example, a bounce from nearby support in the alternate scenario would probably not be constrained by the resistance levels shown on the chart. A breach of 2.79 would keep the alternate alive. A break of 2.90 would make the alternate appear even more favorable.
Our main scenario will be favored by a break of 2.69 as support, which should lead to a quick test of 2.49. Eventual Gann targets for downward wave (c) include 2.20 and 1.93.
Happy spring! With increased volatility in the markets, trading with the right charts gives you a real edge. For the rest of May we’re making an introduction to Trading On The Mark available to new subscribers with a big 20% price reduction. Just use the coupon code HONEYBEE on the Subscribe page to claim your savings.