This is a quick update for our newsletter readers, following up on our July 14 email about the Yen and related ETF. A rejection of the spring/summer rally appears likely, and we can now point to some additional resistance and timing that should be on your radar.
Recall that we have been tracing the Yen as it has progressed through a multi-year Elliott wave triangle, and the triangle appears to be nearly complete. The form counts well as being in the final stages of the final (e) wave.
In fact, price recently tested the resistance we mentioned in the previous newsletter at 0.009488 (inverse 105.40).
The dominant 47-week cycle predicts an inflection soon, with the ideal date being the week of September 13. However we are already in the acceptable time window for a cyclical turn. (Keep in mind the direction of price movement doesn’t always match the cycle’s change in direction. The inflection is more important than whether the cycle appears to be at a high or low.)
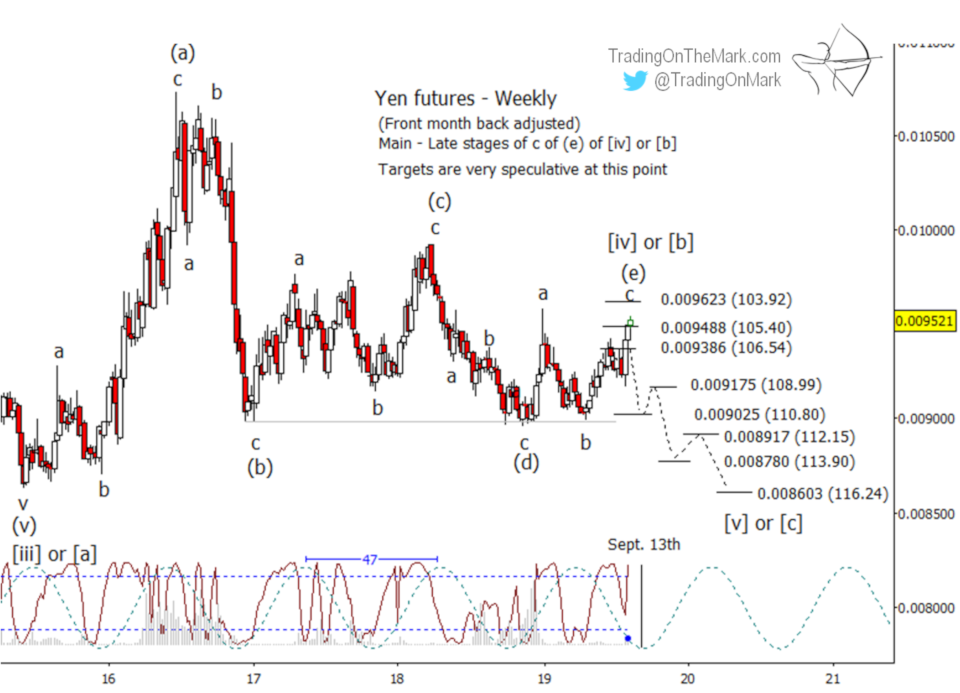
The current placement of the Lomb periodogram on the weekly chart above favors either a pause in the rally or a reversal.
If a reversal takes hold soon, then the nearby resistance can serve the trader as a backstop. On the other hand, price would still be allowed to climb a little higher without violating the triangle pattern. The next higher resistance sits at 0.009623 (inverse 103.92).
A failure of nearby support, previously resistance, at 0.009386 (inverse 106.54) and a weekly close beneath that level would act as initial confirmation of a reversal. If that takes place soon, then some very preliminary targets for a downward cascade include 0.009175 (inverse 108.99), 0.009025 (inverse 110.80), 0.008917 (inverse 112.15), 0.008780 (inverse 113.90), and 0.008603 (inverse 116.24).
Similarly, the CurrencyShares Japanese Yen Trust (symbol FXY) recently tested the resistance we mentioned in the previous newsletter at 90.41. To keep the triangle scenario alive, we don’t want to see the ETF climb above 91.62.
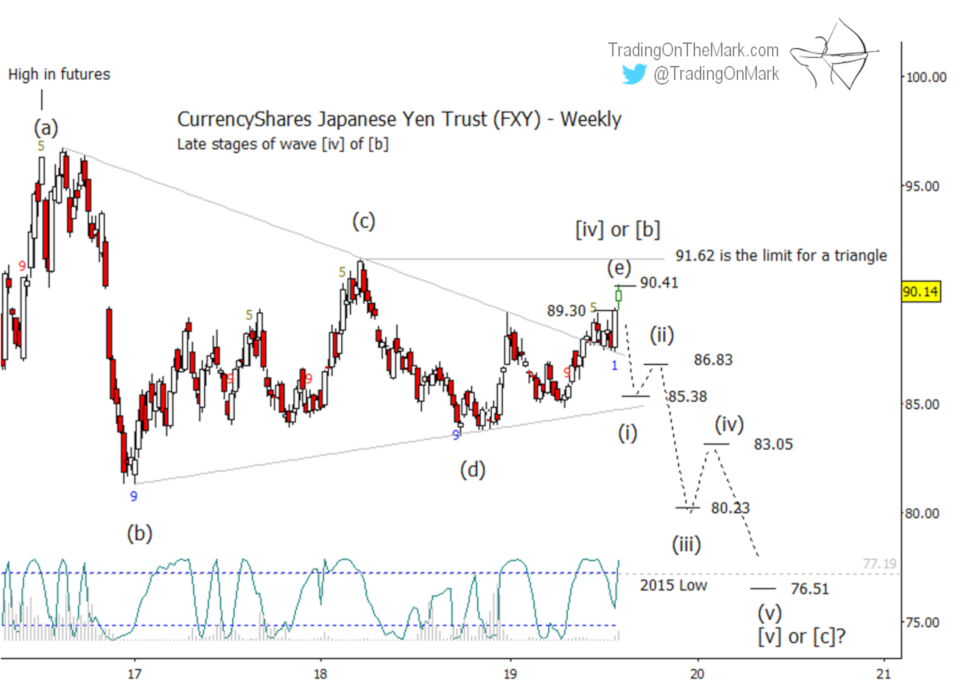
As with the Yen chart, the Lomb periodogram on the FXY chart says the recent rally should pause or possibly reverse soon. A break and weekly close beneath previous resistance at 89.30 can be initial confirmation.
Some preliminary levels for an FXY downward cascade going into the next year include 86.83, 85.39, 83.05, 80.23, and 76.51.
Good fortune to you in your trading!
— Tom and Kurt at Trading On The Mark