This edition of TOTM’s newsletter gives an update on the bullish forecast for the Dollar as well as an update to the chart we sent last week for the natural gas ETF.
Dollar ETF
In our July 2019 email about the Invesco DB US Dollar Index Bullish Fund (NYSEArca: UUP) we wrote that price was trying to bounce from the highest of our supports at 25.90. That bounce worked well, and it produced a rally that exactly reached our middle resistance target at 27.17 in late September.
The fund continues to respond well to the extension targets and retracement levels that would be consistent with a bullish Elliott wave scenario, but we have had to modify our main count in consideration of the deep retrace that printed during the past three weeks.
We view the current retrace as the prelude to a strong move higher.
The revision to our main count has the price high of September 30 as the completion of upward wave (i) of [v]. Basically we have shifted the placement of (i) rightward in comparison to the July chart.
That sets the stage for the current retrace being all or part of a wave (ii) correction. It is already possible to count a three-wave structure in the retrace, so it may be nearing completion.
The Dollar Index informs much of our currency analysis at Trading On The Mark, where we frequently chart the Yen, the British Pound and the Euro for our subscribers.
A Daily Analysis subscription at TOTM gives you constant access to up-to-date with charts on weekly and daily time frames for the Euro, the Dollar Index, gold, crude oil, bonds and the S&P 500. Intraday Analysis offers additional moment-by-moment coverage.
Note also that we are now very near the inflection of the empirical 100-week price cycle, and the Lomb periodogram also flags the current timing as a low.
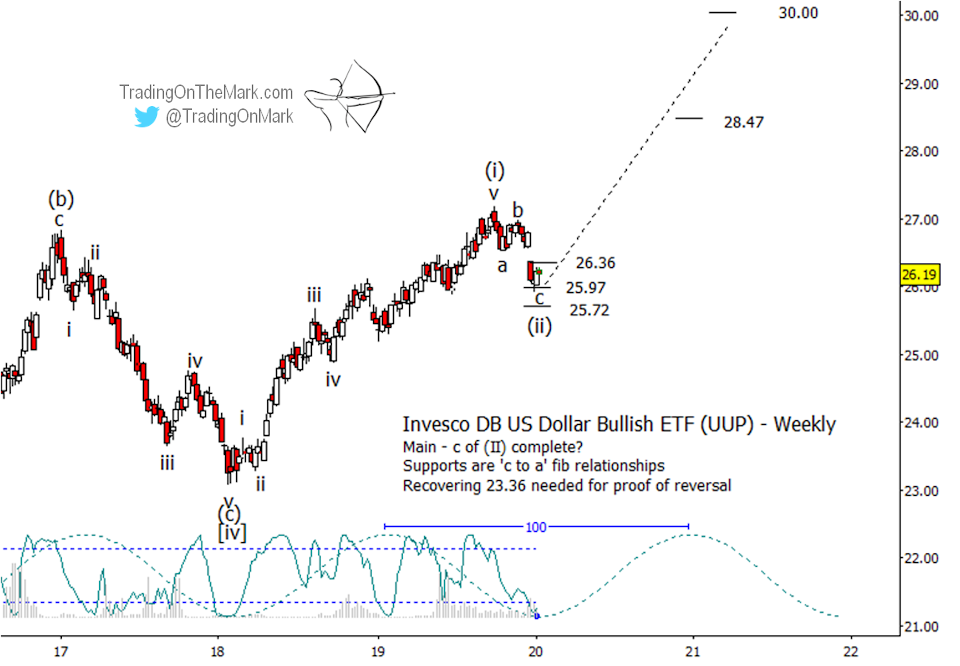
Fibonacci relationships among the sub-waves inside (ii) offer near-term support targets at 26.36, 25.97 and 25.72, with the middle one being tested now. A rebound from the middle support as part of upward wave (iii) should aim for targets roughly near 28.47 or 30.00 – measurements that are based on the magnitude of wave (i).
As Elliott wave readers know, third waves are typically the strongest ones. Ideally we would like to see upward wave (iii) reach at least a 1x1 relationship with the preceding wave (i), which makes 30.00 a reasonable target. However it is quite possible that the fund could reach higher than that while still in a third wave.
Update for natural gas ETF
Late last week the United States Natural Gas Fund (symbol UNG) poked beneath the supports we had drawn on the chart in our previous newsletter. A revised chart is shown here.
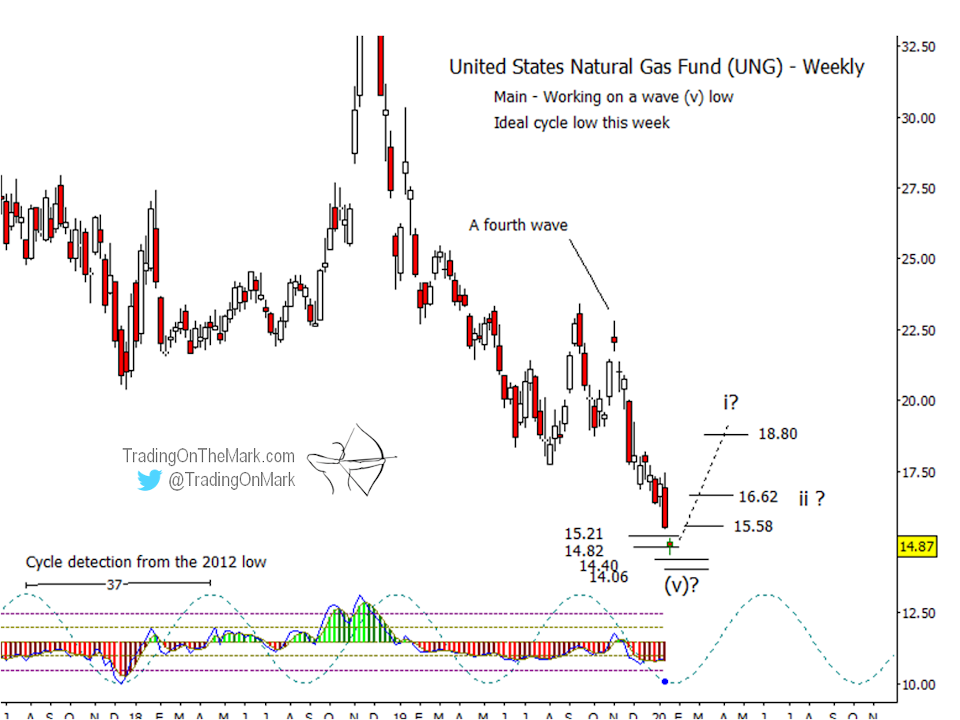
We believe the wave count and timing described earlier still apply, but we have added two near-term supports to watch at 15.21, 14.82, 14.40, and 14.06. This still looks like the right area for a long-term low to form.